Accendo Reliability

Your Reliability Engineering Professional Development Site

  • Home
  • About
    • Contributors
    • About Us
    • Colophon
    • Survey
  • Reliability.fm
  • Articles
    • CRE Preparation Notes
    • NoMTBF
    • on Leadership & Career
      • Advanced Engineering Culture
      • ASQR&R
      • Engineering Leadership
      • Managing in the 2000s
      • Product Development and Process Improvement
    • on Maintenance Reliability
      • Aasan Asset Management
      • AI & Predictive Maintenance
      • Asset Management in the Mining Industry
      • CMMS and Maintenance Management
      • CMMS and Reliability
      • Conscious Asset
      • EAM & CMMS
      • Everyday RCM
      • History of Maintenance Management
      • Life Cycle Asset Management
      • Maintenance and Reliability
      • Maintenance Management
      • Plant Maintenance
      • Process Plant Reliability Engineering
      • RCM Blitz®
      • ReliabilityXperience
      • Rob’s Reliability Project
      • The Intelligent Transformer Blog
      • The People Side of Maintenance
      • The Reliability Mindset
    • on Product Reliability
      • Accelerated Reliability
      • Achieving the Benefits of Reliability
      • Apex Ridge
      • Field Reliability Data Analysis
      • Metals Engineering and Product Reliability
      • Musings on Reliability and Maintenance Topics
      • Product Validation
      • Reliability by Design
      • Reliability Competence
      • Reliability Engineering Insights
      • Reliability in Emerging Technology
      • Reliability Knowledge
    • on Risk & Safety
      • CERM® Risk Insights
      • Equipment Risk and Reliability in Downhole Applications
      • Operational Risk Process Safety
    • on Systems Thinking
      • Communicating with FINESSE
      • The RCA
    • on Tools & Techniques
      • Big Data & Analytics
      • Experimental Design for NPD
      • Innovative Thinking in Reliability and Durability
      • Inside and Beyond HALT
      • Inside FMEA
      • Institute of Quality & Reliability
      • Integral Concepts
      • Learning from Failures
      • Progress in Field Reliability?
      • R for Engineering
      • Reliability Engineering Using Python
      • Reliability Reflections
      • Statistical Methods for Failure-Time Data
      • Testing 1 2 3
      • The Manufacturing Academy
  • eBooks
  • Resources
    • Accendo Authors
    • FMEA Resources
    • Glossary
    • Feed Forward Publications
    • Openings
    • Books
    • Webinar Sources
    • Podcasts
  • Courses
    • Your Courses
    • Live Courses
      • Introduction to Reliability Engineering & Accelerated Testings Course Landing Page
      • Advanced Accelerated Testing Course Landing Page
    • Integral Concepts Courses
      • Reliability Analysis Methods Course Landing Page
      • Applied Reliability Analysis Course Landing Page
      • Statistics, Hypothesis Testing, & Regression Modeling Course Landing Page
      • Measurement System Assessment Course Landing Page
      • SPC & Process Capability Course Landing Page
      • Design of Experiments Course Landing Page
    • The Manufacturing Academy Courses
      • An Introduction to Reliability Engineering
      • Reliability Engineering Statistics
      • An Introduction to Quality Engineering
      • Quality Engineering Statistics
      • FMEA in Practice
      • Process Capability Analysis course
      • Root Cause Analysis and the 8D Corrective Action Process course
      • Return on Investment online course
    • Industrial Metallurgist Courses
    • FMEA courses Powered by The Luminous Group
    • Foundations of RCM online course
    • Reliability Engineering for Heavy Industry
    • How to be an Online Student
    • Quondam Courses
  • Calendar
    • Call for Papers Listing
    • Upcoming Webinars
    • Webinar Calendar
  • Login
    • Member Home
  • Barringer Process Reliability Introduction Course Landing Page
  • Upcoming Live Events
You are here: Home / Articles / Surprising Insights from Simple Run Charts

by Mike Sondalini Leave a Comment

Surprising Insights from Simple Run Charts

Surprising Insights from Simple Run Charts

The late quality guru W. Edwards Deming advised graphing the process variables and the process outputs across time on a run chart (a time-series plot) to identify uncertainty and variability. When the run charts are used together, they help to identify the times and causes of poor results.

Keywords: run chart, control chart, x-bar chart, line graph

ship departure dates shown on a run chart, titled Days between Ships,  with days on vertical access and calendar time on horizontal axis.
Figure 1 Ship Departure Dates
A run chart titled Containers on Ship with number of containers on vertical axis and calendar dates on horizontal axis.
Figure 2 Numbers of Containers on Each Ship

If you want immediate control over a process, then track the process variables—those factors that influence the result—so that they are observable as they change. If the change is bad, you have time to react and correct it before it does too much damage. If you want preemptive control of a

process, then trend the variables of the process inputs before they enter the process. By ensuring that the inputs into a process are correct, you can be more certain that the process they feed will behave right. If you only want to know how well a process performed, then monitor its final outputs after process completion.

Unfortunately, if you only monitor final process outputs it puts you in the position of asking “what happened?” when something goes wrong. Just like the company in the following story, which had no idea what had changed to cause a spate of raw material stock-outs. By tracing the results of the replenishment process on two run charts the company exposed process fluctuations, and one phone call later, the underlying causes were revealed. Waiting to see what the process produced led them into a great deal of trouble that could have been avoided had they tracked the process inputs.

Inventory Replenishment Mayhem

The stock replenishment process of a national company involved the ocean shipment of raw material from a manufacturer on one side of the country to the company’s factory, located five shipping days away on the other side of the country. For some months prior to the investigation, the company had been running out of stock across a range of shipped materials. As a result, the company was unable to supply products on time to clients because the warehouse replenishment process could not maintain adequate raw material stocks. The company was using up safety stock and not getting resupply quickly enough to meet clients’ orders. Annoyed clients reported the problems that this was causing in strongly worded correspondence and angry telephone calls. The company did not know why it was having the stock-outs.

It was necessary to look at the history of deliveries from the manufacturer. Historical records of delivery dates are plotted in Figure 1, which is a run chart graph of the ship departure dates. It shows a great deal of variability in the deliveries over the most recent months. Lately, deliveries were up to two weeks overdue when they should have been arriving weekly.

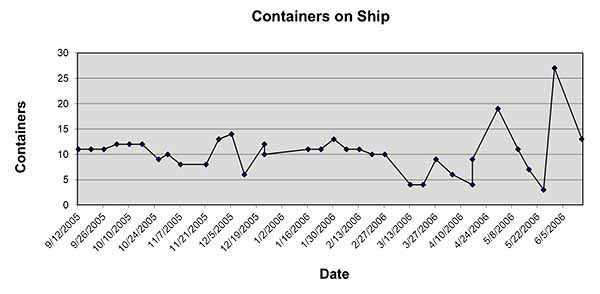
Figure 2 is a graph of the number of sea containers in each delivery. It shows variability in the amount of product sent in each shipment. Instead of having normal deliveries of 10 to 11 sea containers, the company was now receiving shipments ranging from 4 to 27 containers.

Inquiries with the freight forwarder revealed that the regular national shipping line used for deliveries had a two-month maintenance outage for one of its two ships. Whereas once there had been regular weekly shipments, now the only ship left was running fortnightly. To get ordered material to the factory during the maintenance outage, the manufacturer started booking transport with international shipping companies. These ships had irregular departure schedules and only took the number of sea containers needed to fill the empty bays that were left after meeting prior commitments. Sometimes they took a few containers, and other times they took many. The irregular departure of the international carriers with either small or large amounts of raw material resulted in the stock-out mayhem.

The company’s customers suffered because of the erratic supply of raw materials to the manufacturer. The irregularity was attributable to the high variability of international ocean shipping, which was further complicated by the feast-or-famine quantities of product on each ship. There were two possible responses to the temporary shipping problems until the return of the regular national carrier’s serviced vessel. The company could increase the order size shipped fortnightly, which would effectively raise its inventory levels in transit, or it could book transnational rail delivery. Most importantly, to prevent future stock-outs, the manufacturer needed to change its replenishment process to regularly monitor the ocean shipper’s plans and to check for possible delays in shipments.

The disruption of regular delivery to the company in the inventory replenishment example was the result of a “special cause” event—the ship repairs. A special cause event is an extraordinary occurrence in a process that is not attributable to the process itself. Had there been no ship repairs, the weekly deliveries most likely would have been normal. The ship repair was outside the control of the replenishment process, but it had a negative impact on it. If the manufacturer had of monitored the inputs into their shipping process, i.e. what the shipping line was doing, there would have been plentiful time to identify the problem and transport their raw materials by other means.

All the best to you,

Mike Sondalini
Director

Filed Under: Articles, Maintenance Management, on Maintenance Reliability

About Mike Sondalini

In engineering and maintenance since 1974, Mike’s career extends across original equipment manufacturing, beverage processing and packaging, steel fabrication, chemical processing and manufacturing, quality management, project management, enterprise asset management, plant and equipment maintenance, and maintenance training. His specialty is helping companies build highly effective operational risk management processes, develop enterprise asset management systems for ultra-high reliable assets, and instil the precision maintenance skills needed for world class equipment reliability.

« Risk is Round
17 Powerful Insights on Effective Communication Using FINESSE »

Leave a Reply Cancel reply

Your email address will not be published. Required fields are marked *

Headshot of Mike SondaliniArticles by Mike Sondalini
in the Maintenance Management article series

Join Accendo

Receive information and updates about articles and many other resources offered by Accendo Reliability by becoming a member.

It’s free and only takes a minute.

Join Today

Recent Posts

  • Gremlins today
  • The Power of Vision in Leadership and Organizational Success
  • 3 Types of MTBF Stories
  • ALT: An in Depth Description
  • Project Email Economics

© 2025 FMS Reliability · Privacy Policy · Terms of Service · Cookies Policy