Charting historic equipment failure events visually shows the Failure Probability Density Function curve for that equipment. It is also known as a Failure Density Distribution Curve.
VALUE OF A DISTRIBUTION CURVE
Failure Probability Density Function curves, Failure Density Distribution Curves contain useful information about what has happened to equipment. These curves illustrate the chance of failure of an equipment over a period. Here, our fixed variables are the equipment’s components’ material-of-construction and design. As such, the only changing variable is the operating and maintenance strategies, including work processes, used by the company.
This means that when looking at a Failure Probability Density Function graph it is possible to identify the success of the operating and maintenance procedures in use. Below is an example activity used in the Plant Wellness Way EAM Training Courses that illustrates how to use these graphs to identify and improve machinery reliability.
PROCEDURE AS A VARIABLE
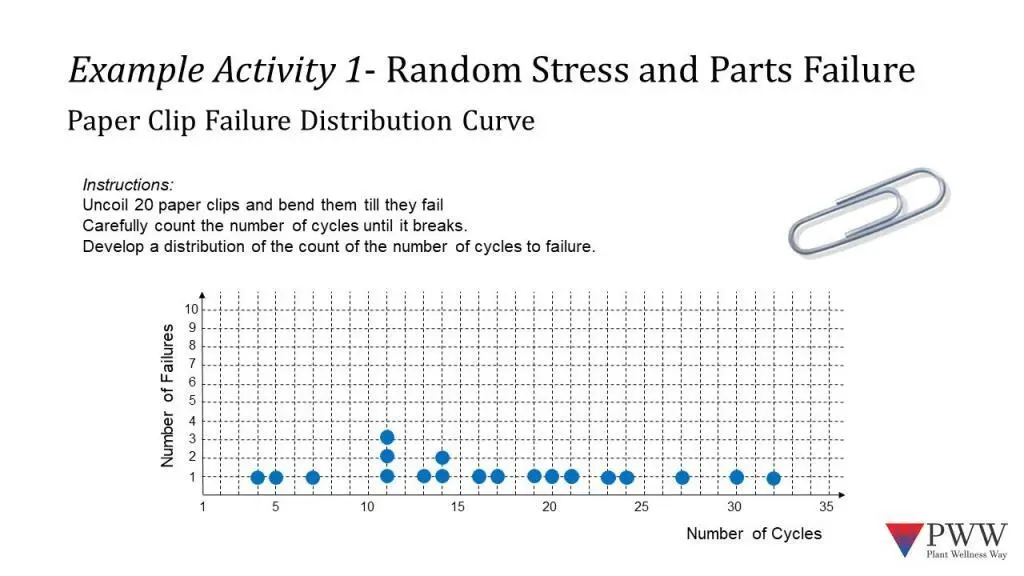
The activity has two parts. Firstly, the participants to break a paperclip in any way they wish. This creates a situation where random stress events occur. Each person chooses how their paperclip fails – be it by bending, twisting, or a combination of those two actions. Participants count the cycles to failure, and this information is plotted on the graph (Figure 1). The spread of point forms a sample Failure Probability Density Function curve of a paper clip.
As the material-of-construction and design of the paper clip are know and consistent across this example, they are not the variables. This means that the only variable in the activity is the way people broke their paperclips. The individual procedures used by the participants are what produced this Failure Probability Density Function curve.
This is a hugely important understanding in equipment reliability improvement: the procedure used is a variable. That is a foundational insight into the Plant Wellness Way EAM methodology.
STANDARD OPERATING PROCEDURES (SOPS) FOR CONTROLLING QUALITY OF WORK OUTCOMES
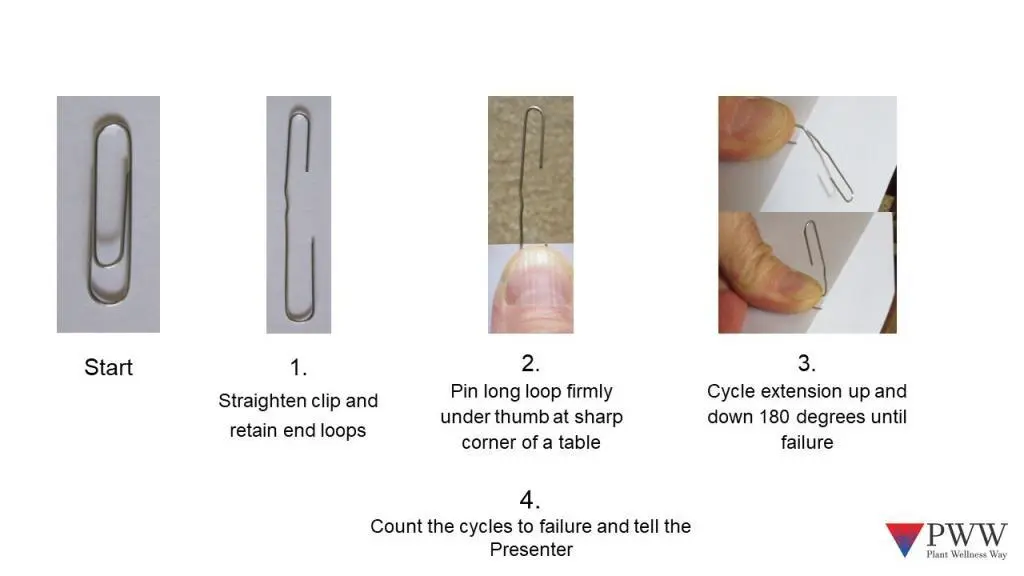
For the second part of this activity, our participants are asked to, again, break a paperclip but this time they must follow specific instructions about how to break the paperclip. In this case, the paper clip is placed on the corner of a table and cycled from zero to 180° opposite position until it fails. Again, the cycles to failure at plotted and create a new Failure Probably Density Function curve.
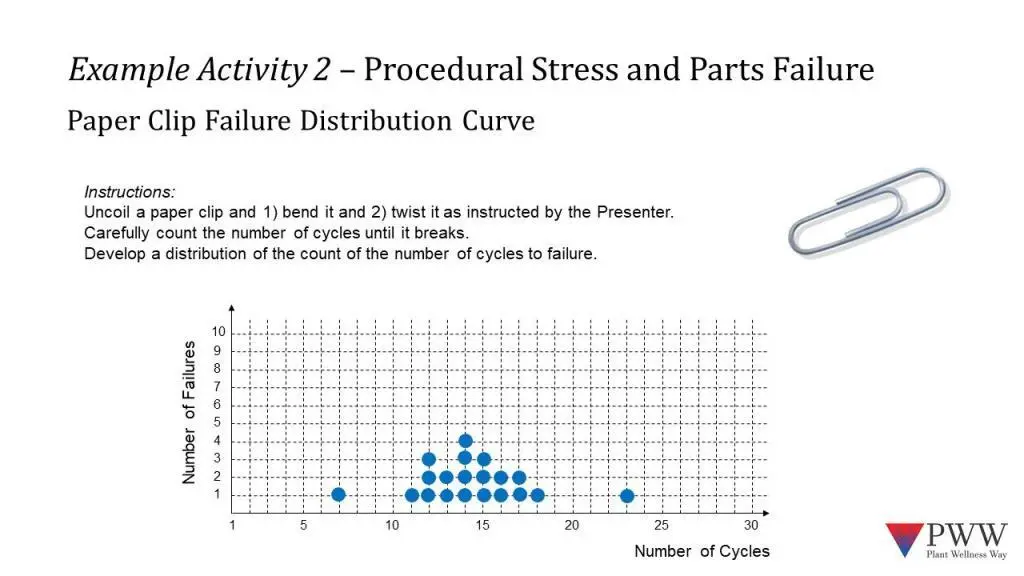
When the new graph, Figure 3, is compared to the previous (Figure 1), the influence of standard operating procedures on the shape of the curve is obvious. The shape of the failure density distribution curve is now narrowed. The randomness of failure counts caused by the various procedures’ participants used is removed. By using a standard operating procedure, the outcomes are controlled to within a tight performance range (11 to 18 cycles to failure).
By controlling the method used to cause this failure, we can predict, within 90% confidence, when a paper clip will fail. If this paperclip were a component, then we could plan preventative maintenance to replace the part before it fails. The graph also allows us to identify outliers – which indicates that there were two occurrences where the SOP was not followed correctly.
One person had only 7 cycles to failure. Had they done the SOP properly they would have produced a failure event somewhere between 11 to 18 cycles. In this instance, the person who produced this result should be retrained in the procedure. Once retrained they should complete a series of trial runs to demonstrate that they now are able to produce results fall within the required distribution.
Another person experienced 23 cycles to failure. While they did not follow the procedure, their approach generated far greater reliability than all the other outcomes. The aim of Standard Operating Procedures should be to both control the quality of work and deliver the greatest reliability. As this person achieved the greatest reliability, it necessary to interview and watch this person to learn how they reached such high reliability.
The information collected from the interview and work observation is used to revise the SOP. This new Standard Operating Procedure will become the company-wide specification. With every revision or creation of a new SOP, everyone is trained in the new procedure and tested to ensure they can perform to the new standard. By doing this process every user will get higher reliability, within a known range of results.
Standard Operating Procedures allow you to control the distribution of task quality, producing repeatable, known results and guaranteed job quality. They should be updated with the latest best practices and users trained to ensure that everyone is able to perform the task with consistency.

Leave a Reply