
Nonparametric, age-specific field reliability estimates helped deal with a Customer’s bad experience using a Hewlett-Packard part in the Customer’s product: 110 part failures out of 3001 shipped in the first five months. Comparison of HP population vs. Customer reliability estimates showed the Customer’s infant mortality was not typical. Using population ships and failures or returns data eliminated sample uncertainty from the HP population field reliability estimate.
This collaboration was an example of nonparametric estimation of age-specific field reliability, without life data [George]. Ships (product sales) and returns, from data required by the U. S. Internal Revenue Service and generally accepted accounting principles [Plank], are statistically sufficient to estimate age-specific field reliability. (Complaints, failures, spares sales, etc. could also be used for returns.) Offer to compare your vendors’ population, age-specific parts’ field reliabilities with the field reliability of their parts in your company’s products. Ask for the vendor’s population ships and returns counts. Comparisons can be enlightening.
Who did what and to whom and with what?
The Customer voiced concern over infant mortality of an HP part in Customer’s product. Was this due to HP or Customer’s product?
The HP Manager and Engineer wanted to compare HP population vs. Customer’s experience. Their question was whether the Customer’s product experience differed statistically significantly from the HP population. They agreed that field reliability described relevant experience. The Manager suggested the Engineer send population part ships and returns counts to me to test that hypothesis.
The Engineer sent part ships and valid returns data from population and Customer, grouped by calendar month (table 1). The Customer’s data consisted of five months of ships and returns.
Table 1. Ships and returns for HP population and Customer. Ships in Jan-93 included last quarter of 1992.
| Month | HP Ships | HP Returns | CustomerShips | CustomerReturns |
| Jan-93 | 89415 | 0 | 0 | 0 |
| Feb-93 | 0 | 0 | 0 | 0 |
| Mar-93 | 0 | 0 | 0 | 0 |
| Apr-93 | 1 | 1 | 0 | 0 |
| etc. | etc. | etc. | etc. | |
| Nov-94 | 9272 | 15 | 885 | 15 |
| Dec-94 | 9229 | 13 | 601 | 13 |
| Jan-95 | 5033 | 29 | 690 | 29 |
| Feb-95 | 10413 | 30 | 405 | 30 |
| Mar-95 | 5199 | 23 | 420 | 23 |
| Apr-95 | 7507 | 41 | 885 | 15 |
The HP Manager said that table 1 HP data was not representative of then-current production (1995). So the Engineer also provided a sample of valid ships and failure dates from 16 failed units out of 257 in May 1995 (table 2). This sample was used to check the validity of the population reliability estimate from all ships and returns and the Manager’s claim.
Table 2. Sample of 16 valid times-to-failures out of 257 parts shipped. Date shipped is Excel DATE() function. Date returned was 33372 (May 1995) for all 16. Sample reliability formula is R(t)=R[t-1]*(1-1/16)*(257/210,622) for t=1,2,…,16 where R(0) = 1 and 210,622 is population size.
| date shipped | t = ttf months | Sample reliability R(t) |
| 32022 | 13.25 | 0.9995 |
| 32029 | 14.64 | 0.9990 |
| 32450 | 16.75 | 0.9986 |
| 32485 | 16.98 | 0.9981 |
| 32492 | 17.44 | 0.9976 |
| 32499 | 18.59 | 0.9971 |
| 32542 | 22.05 | 0.9966 |
| 32570 | 23.21 | 0.9962 |
| 32619 | 23.67 | 0.9957 |
| 32647 | 23.90 | 0.9952 |
| 32654 | 24.82 | 0.9947 |
| 32668 | 26.44 | 0.9942 |
| 32703 | 27.36 | 0.9938 |
| 32808 | 28.78 | 0.9933 |
| 32843 | 29.01 | 0.9928 |
| 32857 | 29.24 | 0.9923 |
Methods and Results
I used the nonparametric maximum likelihood estimator of age-specific field reliability, without life data, on the population and customer data (table 1). Ships and returns data, grouped by accounting interval, are statistically sufficient to estimate age-specific held reliability [George, 1993].
I also estimated nonparametric, age-specific reliability function an HP sample of 16 times-to-failures out of 257 ships tracked by serial number in May 1995. The sample of 257 consisted of ages-at-failures and censored ages, so an empirical reliability estimator was used. The youngest failed unit in the sample of 16 times-to-failures had been in the field for more than 12 months.
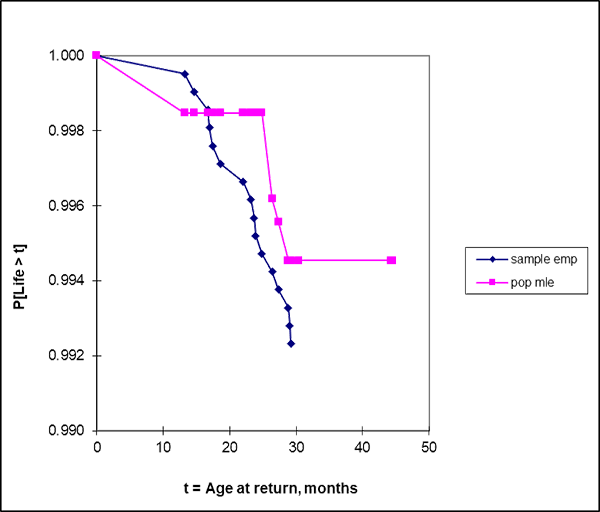
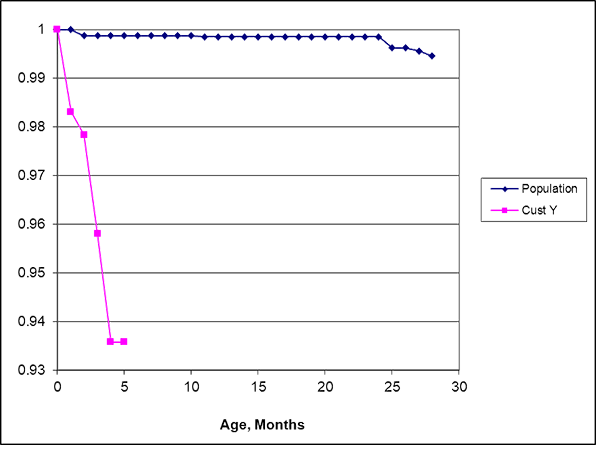
Figure 1 shows that the reliability estimates from population data (“pop mle”) and the sample of 16 failures out of 257 (“sample emp”) agreed tolerably. The disagreement between reliability estimates in the first year of age could have been due to population sell-through time or return delays not in the sample of 16 out of 257. The sample and population monthly return rate function estimates in figure 2 shows some warranty returns in and after the 12-th month, and wearout or annual maintenance effects around age 24 months but no infant mortality. The maximum likelihood estimates of HP population and Customer reliability functions differed in magnitude and shape (figure 3). The difference was so obvious that I didn’t test the null hypothesis that the two reliability functions were the same.

Assumptions and Unanswered Questions
I assumed the HP population returns were from the entire installed base. Agreement with HP population and sample reliability function estimates in figure 1 supports this assumption. There were some HP sample data entry errors. Three return dates were earlier than the population data. The HP sample was treated as 16 times-to-failures from all returns in the recorded shipments.
What else could be done with the age-specific field reliability estimates? These population estimates showed actionable features: infant mortality (Customer, figure 3) and apparent wearout or maintenance effects (HP population). Each could be dealt with.
Process defects cause infant mortality. To deal with infant mortality, identify the Customer’s return (failure) modes. Then identify the root cause(s) searching for process defects from the Customer’s manufacturing through to installation, training and use. Then propose fixes, evaluate whether they’re worthwhile, and, if worthwhile, do the most cost effective fix, then verify the fix. Change design only if you have to. to avoid process defects.
Figure 1 showed population wearout beginning in the second year. HP expected this part to last much longer. Design defects cause premature wearout. However, this part’s apparent wearout may have been due to periodic system maintenance. To fix, look for design or maintenance related return modes or repairs. Don’t forget, verify the fix! How? Compare age-specific field reliability before and after.
Conclusions, Acknowledgement, and Offer
Comparison of HP population vs, Customer field reliability verified the Customer’s concern. The Engineer politely suggested that the Customer’s product application or process might induce infant mortality returns. Comparing the Customer’s age-specific field reliability with population field reliability resolved the concern. It’s hard to argue with population statistics. (In a recent podcast, Fred Schenkelberg mentioned some HP parts that caught fire in European applications with 220 volts. The parts had been tested with 110 volts only.)
The Hewlett-Packard Manager and Engineer deserve credit for sharing their data and the problem and for allowing this publication. This collaboration resulted from my offer to estimate field reliability and diagnose problems from field reliability data, for free. Send field reliability data such as periodic ships and returns counts. If ships are products and returns are parts, send product bills-of-materials so I can compute the parts’ installed base by age from the product installed base by age. Essentially, parts installed base = (product installed base)*(I-N)-1 where N is a goes-into matrix that tells how many of each part are required for each product [Vaszonyi].
References
Tom Plank, Accounting Deskbook, 10-th Edition, Prentice-Hall, New York, 1995
George, L. L., “Estimate Reliability Functions Without Life Data,” ASQ Reliability Review, Vol. 13, No. 1, pp. 21-25, 1993
Andrew Vaszonyi, See “Gozinto Theory and Parts’ Installed Base,” https://fred-schenkelberg-project.prev01.rmkr.net/gozinto-theory-parts-installed-base/#more-417514/. 2022

Leave a Reply