
The Kaplan-Meier estimator is the maximum likelihood, nonparametric reliability estimator for censored, grouped lifetime data. It’s traditional. It’s in statistical software. Greenwood’s variance formula is well known. Could Kaplan-Meier be improved: smaller variance, better actuarial forecasts, seasonality, separate cohort variability from reliability? Could you estimate reliability without life data and preserve privacy?
The title comes from Rupert Miller’s “What Price Kaplan-Meier?” article in which Miller compared nonparametric vs. some parametric survival function estimators. His article spawned similar comparisons, unlike this article: nonparametric Kaplan-Meier vs. nonparametric reliability estimators, without lifetime data!
Lifetime Data for Kaplan-Meier Estimator?
Government and industry standards require lifetime data: 21 CFR821.25, 21 CFR821.30, ISO 14224 [https://fred-schenkelberg-project.prev01.rmkr.net/?s=ISO+14224/], DOD “Guide for Achieving RAM”, and more. Censored lifetime reliability data often comes in cohorts: e.g., periodic cases, ships, or sales, and their corresponding death or failure counts by ages at failures. This data could be a “Nevada” table 1. The Kaplan-Meier (K-M) reliability estimator from table 1 includes cohort randomness as well as randomness in times to failures [Kaplan and Meier].
Table 1. Cohort ships and failure data in a Nevada table (18 periods)
| Cohort | Ships | Period 1 | Period 2 | Period 3 | Period 4 | Period 5 | Period 6 | Etc. |
| 1 | 47 | 1 | 3 | 7 | 8 | 13 | 5 | |
| 2 | 41 | 4 | 3 | 4 | 7 | 6 | ||
| 3 | 45 | 2 | 4 | 9 | 6 | |||
| 4 | 39 | 1 | 6 | 4 | ||||
| 5 | 43 | 2 | 6 | |||||
| 6 | 41 | 0 | ||||||
| Etc. | ||||||||
| Sums | 711 | 1 | 7 | 12 | 17 | 37 | 28 |
Cohort ships and the bottom row of table 1, sums of periodic failure counts, are statistically sufficient to make a nonparametric maximum likelihood reliability estimate (npmle) [George and Agrawal 1973, George 1999]. Ships and returns counts (S&R) are available from sales revenue and service cost data or even spares sales required by generally accepted accounting principles (GAAP). They’re population data. They help separate cohort randomness from randomness in times-to-failures.
If you have failure counts from 18 cohorts as in table 1, why not make 18 Kaplan-Meier reliability estimators from each cohort? They provide more information than a single Kaplan-Meier estimator. They provide better variance estimates than the Greenwood formula. Compare the likelihoods, information, and variances from:
- NPMLE from periodic ships (cohorts) and returns (S&R) counts (bottom row of table 1)
- K-M estimator from survivors at risk and grouped failure counts of same age from all cohorts
- K-M cohort estimator from each cohort’s size and failure counts by row of table 1
Likelihoods?
The likelihood functions “L(probability|data)” for alternative estimators are:
- S&R Npmle: L=𝚷Poisson(λ)Poisson(λG(t)) or 𝚷Poisson(λ(t))Poisson(λ(t)G(t)) (Poisson(λ) is the probability distribution of cohort sizes. Poisson(λG(t)) is that of the output of an M(t)/G/infinity service system with lifetime cumulative distribution function G(t) from Poisson cohorts M(t).) This for periodic data of cohort sizes and total returns in period t.
- K-M : L=𝚷BINOM.DIST(d(t),r(t),a(t),FALSE) (BINOM.DIST() is an Excel function where a(t) is actuarial, age-specific failure rate function to be estimated.), This is for observed failure times t, r(t) the number of survivors at risk, and d(t) the failures or deaths at observed failure ages t
- K-M Cohort: L=𝚷𝚷BINOM.DIST(d(t;j),r(t;j),a(t;j),FALSE) Same as K-M, for each cohort j.
The Npmle S&R likelihood function is from ships and returns counts. “Ships” are cohort sizes in column two of table 1. “Returns” are period sums of failure counts regardless of cohort, from the bottom row of table 1. It assumes ships (cohort sizes) have Poisson distribution(s) and consequently so do period sums of failure counts {Mirasol, George and Agrawal]. It’s hard to disprove that each cohort has a nonstationary Poisson(l(t)) distribution from samples of size one cohort (table 1 column 2) [Nelson and Leemis].
The K-M estimator does not use all the information in the Nevada table. It uses cohort sizes and failure counts (of same ages) on the diagonals of table 1, the “traces” of the Nevada table matrix. The Kaplan-Meier reliability estimator R(t) = Π(1-a(s)), s=1,2,…,t where a(s) are actuarial failure rates a(s) = d(s)/r(s) where d(s) counts the deaths of age s on the diagonals, and r(s) is the number of survivors to age s (at risk). The death counts have binomial distributions with failure probability a(s) conditional on survival to age s.
The K-M Cohort likelihood is the same as that of the Kaplan-Meier estimator, for each cohort, multiplied together. It uses the failure counts from each cohort j. The K-M estimates by cohort uses all information in the Nevada table.
An Excel spreadsheet and a VBA program compute the maximum likelihood reliability estimator from ships and returns counts [George and Agrawal, George 1999, George 2019]. Excel’s Solver maximizes likelihoods as functions of probability distributions. The Solver maximum likelihood K-M estimator was the same as from the K-M formula for the K-M estimator. The Solver maximum likelihood reliability estimator from ships and returns was the same as from the spreadsheet estimator.
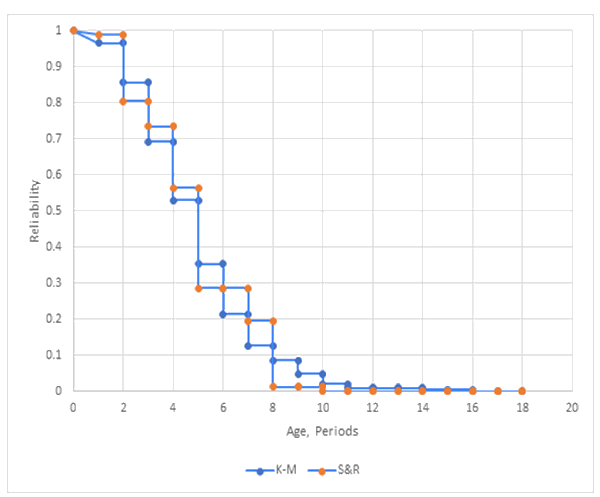
The nonparametric maximum likelihood reliability estimates from ships and returns (S&R) were the same whether cohort variability was included or not (table 2). Their likelihoods differ because cohort variability was included or excluded.
The K-M estimator by cohort yields 18 nonparametric reliability and actuarial failure rate function estimates for cohorts 1,2,…,18 for ages from 1 to 18,17,…,1 respectively. Excel’s Solver complained “Too many variables” when asked to maximize likelihood for all 18X18/2 = 162 cohort failure rates. I had to constrain them, 1E-12<=a(t)<=0.999999, to prevent probability formulas from blowing up. So I maximized likelihoods in batches of 10 and 8 cohorts and rechecked.
Table 2. Maximum likelihoods, entropies. “K-L Div” (Kullback-Leibler divergence from the K-M estimate), and “AIC” (Akaike Information Criterion=2*|number of parameters|-ln(L).)
| Method | Likelihood | Entropy | K-L Div. from K-M | AIC |
| K-M npmle | 7.88E-108 | 2.1691 | 0 | 282.6 |
| S&R Npmle | 3.31E-48 | 2.5800 | 0.6276 | 145.2 |
| K-M by cohort | 1.27E-220 | ~3.1908 | 0 | 668.3 |
| S&R wo cohort | 1.27E-23 | 2.5800 | 0.6276 | 536.7 |
Information?
The results differ from what I expected; I expected K-M to be a better estimator than the reliability estimator from S&R. Likelihood from ships and returns, 3.31E-48, is larger than the K-M likelihood, 7.88E-108, is larger than the K-M by cohort likelihood, 1.27E-220. The likelihood of the K-M by cohort is the product of 18 likelihoods, which explains why it is so small. The entropy of the S&R Npmle is more than the Kaplan-Meier estimator! I.e., it provides more information. The K-L divergence confirms that observation. The K-M Cohort entropy ~3.190 is that of the single semi-nonparametric, proportional hazards, reliability function estimate constructed from 18 individual cohort reliability function estimates in a previous article about seasonal reliability estimation [George 2024].
Cohort sizes and period failure counts (ships and returns) seem to contain less information than cohort sizes and grouped failure counts (K-M). K-M grouped failure counts by age contains less information than failure counts by cohort. But the S&R npmle makes the Poisson assumption about cohort size distribution. That’s why the S&R npmle likelihood is greater than K-M likelihood.
Entropy =-Σp(t)ln(p(t) measures the information in a reliability function estimate, p(t)=R(t)-R(t-1). Using natural “ln” natural logarithm in entropy yields “nats”. Log base 2 would give information in bits. The K-M Cohort entropy is computed from the semi-nonparametric seasonal failure rate function ao(t)EXP[Z1β1+Z2β2] where Z1=1,2,or 3 representing quarterly cohort variation, Z2=Period mod 12, and the β-values are regression coefficients [George April 2024].
The npmle from S&R (ships and returns) contains cohort variability as well as variability in times to failures and censoring. If the cohort variability is removed by using the average cohort size 39.5, then the npmle likelihood is 3.53E-219 is a little more likely than the K-M Cohort, but less than the likelihood of the Kaplan-Meier estimator.
Variances of Alternative Estimators?
Entropy and AIC measure bits of information contained in reliability estimates. The Kullback-Leibler divergence, Σp(t)ln(p(t)/q(t)), measures bits of additional information provided by one probability distribution estimator p(t) vs. another q(t). Entropy, K-L divergence, and AIC compare alternative data inputs, for marginal analysis: dbits/d$$$.
Statisticians compare variances of alternative estimators; they define estimator efficiency as VAR(estimator)/Cramer-Rao variance. The Cramer-Rao (C-R) variance is an asymptotic lower bound for maximum likelihood estimators. Greenwood’s formula is a Cramer-Rao bound. The variance of the S&R Npmle is also a Cramer-Rao bound, excluding cohort variability. The “K-M cohort” variances are those of the 18 cohort reliability function estimates.
Table 3. Variance of reliability estimates: K-M Greenwood, K-M Cohort, and S&R Npmle reliability estimates. K-M reliability estimate was 0 after age 15 periods; the S&R estimate was zero after age 9 periods.
| Age, Periods | K-M Greenwood | K-M Cohort | S&R npmle |
| 1 | 0.0000477 | 0.0005858 | 0.0004340 |
| 2 | 0.0001824 | 0.0019554 | 0.008396 |
| 3 | 0.0003263 | 0.0032693 | 0.003333 |
| 4 | 0.0003983 | 0.004271 | 0.05882 |
| 5 | 0.0003831 | 0.004108 | 0.0001941 |
| 6 | 0.0002964 | 0.00444 | 0.05880 |
| 7 | 0.0002088 | 0.00162 | 0.03030 |
| 8 | 0.0000986 | 0.002255 | 0.11025 |
| 9 | 0.0000504 | 0.001001 | 0.01110 |
| 10 | 0.0000233 | 0.000261 | |
| 11 | 0.0000233 | 0.000168 | |
| 12 | 0.00009865 | 0.000149 | |
| 13 | 0.00002329 | 0.000167 | |
| 14 | 0.00001503 | 0.000119 | |
| 15 | 0.00001503 | 0.000119 |
Greenwood’s variance drastically underestimates variance of the K-M reliability estimator from the data in table 1. The K-M cohort variances are close to the S&R Npmle Cramer-Rao bound on the reliability variances from ships and returns counts, without lifetime data.
Conclusions?
One example does not prove a theorem, but it should get your attention. Ships and returns counts are essentially free, from data required by GAAP, to estimate reliability for products and parts not tracked by name and serial number from first use to failure.
Wikipedia says, “ Periodic cases and deaths counts are statistically sufficient to make non-parametric maximum likelihood and least squares estimates of survival functions, without lifetime data.” [https://en.wikipedia.org/wiki/Survival_function/]. Cases could be ships, sales, or cohorts, and deaths could be complaints, failures, returns, recoveries, etc. Wikipedia doesn’t say how to do it.
Periodic cases or ships (cohorts) and failure or death counts preserve privacy, because they do not include peoples’ names or products’ or parts’ serial numbers [NIST]. Kaplan-Meier software usually costs $$$; I give it away. Lifetime data costs $$$. ISO 14224 requires lifetime data and OREDA sells CMMS software to collect it (300+ Euro/year). Auditors make sure you collect required data, but no more than required.
This article shows ships (cohorts) and returns (failure counts) yield more information than the Kaplan-Meier reliability estimator, with approximately the same variance as K-M Cohort estimators. GAAP require data that can be used to compute ship cohorts and returns counts by age, product, and service part. (Use BoMs and gozinto theory to convert product installed base by age into part installed base by age.) That requires work up front, but ships and returns counts provide sufficient data for population reliability estimates, without lifetime data. Commercial statistics programs don’t do it. Excel (VBA) and R do [George 2019]. Mark Felthauser helped me with the R-scripts to do it..
The Kaplan-Meier estimator is not for recurrent process failure counts [George 2023]. It’s for failure counts of products or parts that stay dead. If you want reliability estimates for recurrent processes where failures may have prior failures, send ships and returns data to pstlarry@yahoo.com and describe it.
References
21 CFR821.25, Subpart B “Tracking Requirements,” “Device Tracking System and Content Requirements: Manufacturer Requirements,” Aug. 2017
21 CFR821.30 “Subchapter H,” “Medical Devices, Medical Device Tracking Requirements,” April 2016
“DOD Guide for Achieving Reliability, Availability, and Maintainability,” Aug. 2004
Greenwood, M., “The Errors of Sampling of the Survivorship Tables,” Reports on Public Healthand Statistical Subjects, no. 33, London: HMSO. Appendix 1, 1926
Kaplan, E. L. and Paul Meier, “Non–Parametric Estimation From Incomplete Data”. Jour. Amer. Statist. Assn., Vol. 53, pp. 457–481, 1958
Miller, R. G. Jr. “What price Kaplan-Meier?” Biometrics; vol. 39, no. 4, pp. 1077-81, PMID: 6671119, Dec. 1983
Mirasol, Noel M., The Output of an M/G/infinity Queuing System is Poisson,” Operations Research, vol. 11, pp. 282-284, 1963
Nelson, Barry L. and Lawrence M. Leemis, “The Ease of Fitting but Futility of Testing a Nonstationary Poisson Processes From One Sample Path,” Proceedings of the 2020 Winter Simulation Conference, IEEE, 2020
NIST, Paul A. Grassi, Michael E. Garcia, and James L. Fenton, “Digital Identity Guidelines,” 800-63-3, https://doi.org/10.6028/NIST.SP.800-63-3/, June 2017
References by George
George, L. L. and A. Agrawal, “Estimation of a Hidden Service Time Distribution for an M/G/Infinity Service System,” Nav. Res. Log. Quart., vol. 20, no. 3, pp. 549-555 , 1973
George, L. L., “Field Reliability Estimation Without Life Data,” ASA SPES Newsletter, Dec. 1999
George, L. L., Random-Tandem Queues and Reliability Estimation Without Life Data, Random-Tandem Queues and Reliability Estimation, WIthout Life Data – Field Reliability (google.com)/, 2019
George, L. L., “Kaplan-Meier Estimator for Renewal Processes?”, Weekly Update,https://fred-schenkelberg-project.prev01.rmkr.net/kaplan-meier-estimator-for-renewal-processes/#more-531665/, Nov. 2023
George, L. L., “What if Ships Cohorts were Random?” Weekly Update, https://fred-schenkelberg-project.prev01.rmkr.net/what-if-ships-cohorts-were-random/#more-534951, Jan. 2024
George, L. L., “Do the Best You Can With Available Data?” Weekly Update, https://fred-schenkelberg-project.prev01.rmkr.net/?s=Do+the+best+you+can/, March 2024
George, L.L., “Semi-Nonparametric Reliability Estimation and Seasonal Forecasts,” Weekly Update,https://fred-schenkelberg-project.prev01.rmkr.net/semi-nonparametric-reliability-estimation-and-seasonal-forecasts/#more-546910/, April 2024

I am a retired Statistics Professor from University of Kentucky.
I wrote a paper investigating if the Kaplan-Meier and Nelson-Aalen estimator
(mean integrated) reach the CR lower bound. The tricky part is to calculate
the CR lower bound.
You can see the paper at
https://www.ms.uky.edu/~mai/research/KMInfoJNS.pdf
Thank you for your paper. I saved it and will think about the difference between iid failure times and censoring times vs. periodic cohorts and their failure and censoring times.
Being an engineer, I computed the cohort variance-covariance and noticed the differences from Greenwood.
PS I taught at University of Louisville, Speed School of Engineering from 1973 to 1975