Originally published in the ASQC Reliability Review, Vol. 15, No. 3, Sept. 1995
This article shows reductio ad absurdum in action. Yes you can achieve any MTBF you want, by mixing products with Weibull life distributions, but you won’t want the consequences. The article also shows the absurdity of specifying MTBF, alone.
Specifications usually specify MTBF
According to surveys, the most important factor in customer satisfaction is reliability. Otherwise well-intentioned people, dedicated to providing quality products and customer satisfaction, equate reliability and MTBF. So they specify an MTBF they think will be as good as the competition; 50,000 hours is common and 500,000 hours has been claimed in a few advertisements. Fifty thousand hours at the rate of 40 hours per week for 50 weeks per year is 25 years.
Through the miracle of reliability statistics, you can have any MTBF by simply mixing in products with a decreasing failure rate. Assume products have Weibull life distributions for this article.
The Weibull distribution with decreasing failure rate has surprisingly large mean
Figure 1 graphs the mean and median as functions of the Weibull shape parameter, the exponent of the exponent. Shape parameter values less than 1.0 represent decreasing failure rate functions and infant mortality. The scale parameter is 10,000 for figure 1, corresponding to a mean of 10,000 if the shape parameter is 1.0, the exponential distribution. Smaller values of the shape parameter correspond to large means!
Figure 1. Mean (upper line) and median for the Weibull distribution
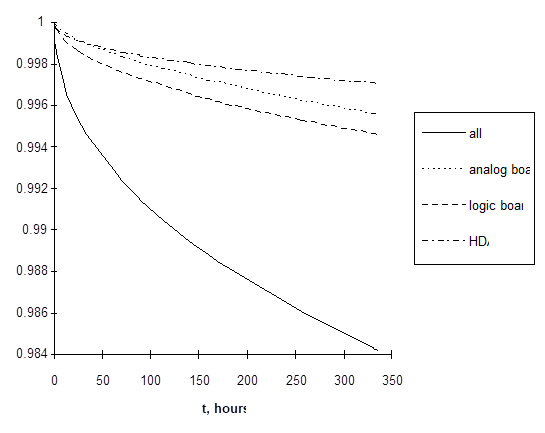
I learned this when I analyzed time-to-failure data from three weeks of continuous computer testing. Weibull distributions with decreasing failure rates fit the data remarkably well. Figure 2 shows some. Assuming these Weibull distributions represent the entire population, the mean lives in hours would be:
• analog board 3,000,000
• HDA 200,000,000
• logic board 1,000,000
• whole computer 5,000,000
The data corresponds to the first 1.5% of the failures, so the mean lives may not be that long.

Mixture of two Weibull distributions gives any MTBF you want
Mixing two life distributions means that product life is randomly selected from one of two distributions. You can choose the MTBF by choosing the mixing probabilities and the distribution parameters. For example, suppose you want a 50,000 hour MTBF and suppose field data showed that the shape and scale parameters of your product were 2 and 10,000 giving an MTBF of only 8862 hours (figure 1). Suppose you had some product in a dumpster that had shape and scale parameters of .145 and 100. Mix in 10% of the latter and you get an MTBF of 50,000 hours (figure 2, right hand end).
What do you really want?
Probability of failure in warranty? Probability of failure during useful life? The probability of failure in a one-year warranty for example is 0.57. The probability of failure in five years is 0.99. You could hope the customers don’t use the product full time. Eighty-five percent of the lousy 10% subpopulation will fail in the first year, so you could remove them after reliability certification but before shipping. To avoid warranty returns, don’t ship the lousy units. Tell customers burn-in eliminated the lousy units. You’re really interested in life cycle cost aren’t you? Your customers are.
It’s fairly difficult to estimate a mixture distribution from censored data because failed units from the lousy population dominate the sample even though they are a small proportion of the population. If you have fairly complete sample data, I can estimate mixture distributions. Send your data and I’ll estimate mixture of Weibulls, normals and lognormals.
How do you verify field specifications?
This requires field data. It’s obvious, but how often is there real field data? Most people say they don’t have field times-to-failures because it’s too much trouble to track each product from shipment to the time it fails. You’re lucky if you can recover information about how many were sold and how many were repaired or replaced. That’s sufficient to estimate the time to failure distribution! If you have ships and returns data, send it to pstlarry@yahoo.com, and I’ll estimate nonparametric reliability and failure rate functions. If possible, I’ll estimate a mixture distribution to fit your data or at least fit the estimators. Then you can do something constructive about life cycle cost, and perhaps about absurd, untestable specifications.


 Ask a question or send along a comment.
Please login to view and use the contact form.
Leave a Reply