Industrial operations that have operating horizons exceeding the lifespan of their assets face a crucial decision as they approach this timeline’s end (but not enough to operate the equipment until its full economically optimal life).
Specifically, they must decide whether to overhaul the asset, replace it with a new one, or rent the equipment until operations conclude. Given the numerous variables with inherent uncertainties in the financial models, how can they be confident in their decision?

You may have encountered financial models that use data-tables for sensitivity analyses, adjusting one variable at a time to gauge its impact. However, this approach becomes cumbersome and overly complex with multiple inputs. Ideally, the objective is to distill the strategy’s strength into a concise statement, such as:
“There’s an 86% probability that overhauling is financially more advantageous than replacing the asset”
Clean, one single sentence, and easy to understand. And in all honesty, its not that hard either, with a little Excel knowledge and Statistics!
Let me explain…
If I want to calculate the cost of purchasing a mining haul truck in 4 years’ time, what are the variables I must consider when making my calculation?
- Purchase price
- Exchange Rate
- Shipping and Transport Costs
- Mobilization costs and labor for site install
- Discount rate for NPV calculations when comparing other options
All of the above items are variable with time and the final cost number will be vastly different when calculated today versus 4 years in the future.
Input Variability & Distributions
Purchase prices are influenced by the manufacturer’s material, labor costs, and required profit margins, especially in a fluctuating economy. The foreign exchange rate shifts based on fiscal policy discrepancies between the operating and manufacturing countries and capital flows. Shipping costs, influenced by fuel prices and supply-demand balances, have shown potential to double or triple (remember COVID?). Labor rates are influenced by the Consumer Price Index and job market dynamics. Lastly, NPV discount rates hinge on the company’s weighted cost of capital, which is affected by debt interest rates and shareholder return expectations.
We may not be able to predict the exact value of these variables, however we can predict a likely range, and even skew the values one way if we have some certainty on the direction of its influencing factors. Some of these variables are also somewhat correlated, however for simplicity, and to keep this article short, isn’t covered here.
We know Reserve Banks around the world are continually raising interest rates to curb inflation, so we can for example assume that the rate of 6% today in Australia will most likely be higher in 4 years’ time. We can model these variations in a statistical distribution specific to that input. I’ve found that BETA-Pert distributions (a continuous distribution) are quite flexible in this manner, however Normal, Triangular and Discrete Discrete distributions are also used widely.

Monte Carlo Simulations
Monte Carlo simulations are computational techniques that leverage randomness to solve problems that might be deterministic in principle. Essentially, they involve running a model numerous times with varying input parameters to generate a range of outcomes and assess their probabilities.
In a Monte Carlo simulation, each iteration selects a value for each input based on its designated distribution and computes the desired outcome, whether that’s cost, NPV, or a comparative metric. This outcome is recorded, and the process is repeated, often thousands of times, until the predetermined number of simulations is achieved. Instead of yielding a single fixed result, the simulation provides a range of outcomes that typically form a distribution. This distribution often resembles a normal curve due to the Central Limit Theorem (elaborated in the subsequent section) and can be characterized by metrics like its mean, variance, and skewness.
Central Limit Theorem
An important concept that I will briefly touch on is the Central Limit Theorem…
The Central Limit Theorem (CLT) asserts that, given a sufficiently large sample size, the distribution of the sum (or average) of many independent, identically distributed random variables will approach a normal distribution, regardless of the original distributions of these variables. In the context of Monte Carlo simulations, the CLT is foundational: even if the individual input variables have non-normal distributions, as the number of iterations (simulations) increases, the resulting distribution of outcomes (e.g., net present values, project returns) will tend towards a normal distribution. This property enables analysts to make probabilistic inferences about the simulated outcomes using familiar statistical measures, such as means and standard deviations, even when dealing with complex, multi-variable systems.
Case Study Example: Mining Excavator
Anyway, onto the most exciting bit, the Case Study Example! For this to work, you must install the free Argo Excel add-in from Booz Allen Hamilton at: https://boozallen.github.io/argo/
This add-in makes adding in the distributions and performing the Monte Carlo process so much easier. You can download the template with formula’s from the submission form at the bottom of the article HERE.
In this example, I’ve already compiled the annual cashflows up to the operation’s end-of-life for three scenarios: purchasing a new excavator, hiring one, or overhauling the existing unit. Our primary focus will be on the difference in NPV (referred to as NPC here since we’re evaluating costs, with higher NPC being less desirable) among these scenarios. This approach aims to identify the most cost-effective strategy and to evaluate the strength of the optimal decision compared to the other two options.
The underlying principle is simple: if the Net Present Cost of one scenario consistently stays below another for the majority of simulations (over 50%), then it emerges as the dominant strategy.
Model Layout

The above image shows the general layout of the model. Inputs, General Info and of course the NPC/NPV calculation with the target cell being the difference in NPC between the strategies (Decision certainty section).
In the “Decision Certainty” section, I’ve positioned the Overhaul option as the primary strategy for comparison against the other two options. Feel free to adjust the arrangement, but ensure you maintain clarity on which cells are being subtracted from one another. Based on the current input variables, without resorting to simulations, the “Overhaul over Replace” result is negative. This suggests that Overhauling is the more cost-effective choice due to the way I’ve arranged the subtraction (Cell output = Overhaul – Replace cost).
Simulation Setup & Run
The below image gives some clarity around the input table. Here I’ve used a Beta-PERT distribution with a Min, Mode and Max value. I’ve left skewness out for this example. To do this with the Argo add-in, simply type in the blue highlighted cell: =@RtaBETAPERT(Min,Mode,Max) or you can use the User interface in the ribbons.

For the result cell Using the Argo tab, you can select “Result”-”Add Result” and select the result cell, which in this case is the “Overhaul vs Replace” cell below. You can also enter this by formula.

Now, press the simulate tab and the program will perform 1000 iterations. This might take a few seconds. Remember, for each iteration its selecting a value of the distribution you specified for each input, and calculating and saving the “Result” cell’s value. This at the end is the distribution we really care about for making a decision.
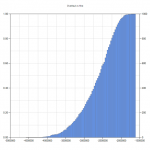
After this, select the results cell and click on : “Analysis Wizard”- “Selected Cell”. This will now display your CDF’s and statistics.

As we can see, the Mean Benefit of Overhaul over Hiring is $3,408,433. The minimum is approx. $747K, which means there is a 100% chance that Overhauling will be more financially favorable than Replacing an Excavator

In conclusion, the use of Monte Carlo Simulations in Excel offers an invaluable tool for managing uncertainty when making asset replacement decisions.
By leveraging Excel, a tool used by every Reliability Engineer, we can gain a deeper, probabilistic insight into potential outcomes and uncertainties. This approach not only streamlines the decision-making process but also instills confidence by quantifying the range and likelihood of potential outcomes.

Leave a Reply