
Crow-AMSAA Analysis Overview
Crow-AMSAA Plots have a variety of names, such as Reliability Growth Plots or Duane Plots. The term “Crow” comes from Dr Larry H. Crow, who enhanced James T. Duane’s pioneering launch of this methodology, which was developed in the early 1960s (1). Crow successfully applied the method in the US Army Materials System Analysis Activity (AMSAA). The technique has blossomed into large amounts of new applications in industry such as but not limited to:
- Making reliability more visible and manageable hence contributing to Reliability Improvement Programs,
- Monitoring Design Optimization and Quality Performance,
- Catastrophic or adverse event occurrence predictions and trends which in essence are the objective of this article.
In practical terms, The Crow-AMSAA technique involves plotting, most commonly, cumulative failures vs cumulative time on a log-log scale resulting in straight line plots (2). The line slope value (or Beta value) indicates improving, deteriorating, or constant failure occurrences. Due to the straight-line nature of the plots, future failure forecasts can be estimated. In plain words, based on the current trend, when is the next failure expected to occur? This method handles mixed failure modes, so it is, therefore, suitable for the complex nature of the generating units.
The case of waste landfill fire starts in Seychelles
The island nation of Seychelles is located in the Indian Ocean. It is officially part of the African continent. As well as being a tropical paradise, it is also a prized tourism destination. In the last 4 decades, the former British Colony has witnessed a significant increase in per capita income mainly due to its flourishing tourism industry making it the richest country in Africa today. This radical improvement in the standard of living has been a welcome benefit to the country but has also come with adverse consequences. The increase in consumption of material goods has led to an alarming accumulation of waste, notably in the Providence Landfill located next to the capital city, Victoria.
Poor waste management and elimination practices have led to the landfill site reaching its input capacity in 2025. One of the adverse consequences of waste accumulation is frequent spontaneous ignition and subsequent landfill fires. The landfill is in close proximity to densely populated areas. The fire events release toxins into the environment and put firefighters and the nearby residents at risk. It is a major blot to the environmental image this tourism focused destination strives to maintain. This article uses the Crow-AMSAA methodology to assess the frequency and evolution of those fire events.
The fire events appear to be spontaneous. This implies that physico-chemical elements combine and create the appropriate conditions for an ignition. This could be as simple as a battery exploding under high-temperature conditions or a set of chemical compounds mixing up. Methane gasses act as fuel for the fire. Methane is a by-product of garbage decomposition. There could be other modes of ignition as well. However, this implies the presence of mixed modes that are well covered by the Crow-AMSAA methodology.
Garbage is continuously added to the landfill mass. The input amount is estimated at around 90,000 tons per year. This also suggests more “fuel” to the existing degradation, leading to more events, again well-modelled by a Reliability Growth method.
Practical analysis of fire events
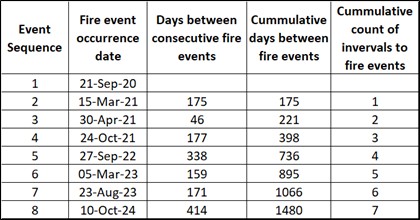
Eight landfill fire events requiring large-scale fire services intervention have been recorded since September 2020. Those records were mainly from media reports. There are no records available to the author before this date. Table 1 below highlights the records obtained as well as the cumulative calculations required by the Crow-AMSAA Methodology. Note that because we have no records prior to September 2020, the cumulative occurrence values start with Event Sequence #2. The last 2 columns in Table 1 are used to build the Crow-AMSAA plot.
The Crow-AMSAA plot relative to the above table is provided in Graph 1 below.

The interpretation of Graph 1 is as follows:
- The correlation value (R2) is quite high at 0.943 indicating that we have a “reasonable” model for the data.
- The Beta value (or line slope) is at 0.816. It stands at less than 1 meaning that there is an improvement in the trend of fire starts. In practical terms, the fire events will occur less frequently over time if the same model applies.
- In line with the above comment, the Mean Time Between Failures (MTBF) or fire events in this case, is 240.81 days. In practical terms we can expects a fire start every 241 days. However, due to the Beta value being less than 1, the next occurrence (fire event #9) is expected to occur after 241 days, specifically at 263 days after the last occurrence. This projects the next fire event to occur on June 30th, 2025.
This is a very basic analysis of the fire start trend. June 30th, 2025 is a projected date and not necessarily the exact date of occurrence. The 90% confidence boundaries, not shown here, are quite wide. This is not unexpected as we have under 10 data points, which is considered a low amount. We also have the issue of the first event, which is not really the first event. Hence, there is a lot of uncertainty in this model, but it is still better than no model.
The other important information that can be correlated with the current reality of this landfill site is that fires will continue to occur on a yearly basis. According to the author’s information, not much has changed in terms of waste management and input. Therefore, no different result can be expected. This is akin to the “definition of insanity”: “do nothing different yet expect a different result”.
The Crow-AMSAA plot in Graph 1 is built using time or chronological records. However, if landfill input data were available, a different Crow-AMSAA model based on input tonnes could be built. At the end of the day, the objective would be to find out which variable provides the best predictive model for landfill fires. Is it the time variable model or the landfill input variable model? And why not some other variable, such as type of waste material?
Analysis learnings and conclusion
This Crow-AMSAA analysis, though basic and with sparse data, provides a methodology to predict adverse and undesirable events. It is by no means a solution to the problem itself. It simply highlights the gravity and the expected future of the situation. Typically, when faced with problems in industry, the first step is to quantify the issue. Based on the risk associated, the issue will be addressed in terms of priority. Even with sparse or disrupted data, one can build forecasts and make some informed decisions on the situation. As more data is available, better models can be built.
It must be noted that landfill fires occur frequently worldwide and not only in Seychelles. As with every problem of this type, the longer it is ignored, the more resource-intensive the solution. The implementation of any solution will take years or decades and come at a high cost. But the benefits are certainly there in terms of:
- Public health preservation
- Risk reduction of even more catastrophic events such a major explosion unseen in the past
- Land recovery (i.e. reducing the footprint of the landfill site and getting back scarce land)
- Technological advancement and wealth creation through better waste management (i.e. skilled workers, jobs and other financial benefits)
- Not to be ignored, the improvement of environmental preservation performance which is key to a tourism destination like Seychelles.
Another important aspect of this analysis is that we, as Reliability Engineers, through our mastery of statistics, should bring our skills to the communities at large and not only to our industry.
1. Robert B. Abernethy, The New Weibull Handbook, 5th Edition (2007), Section 9.1-9.2.
2. Nigel Comerford, Crow/AMSAA Reliability Growth Plots, 16th Annual Conference 2005 – Rotorua.

Leave a Reply