Accendo Reliability

Your Reliability Engineering Professional Development Site

  • Home
  • About
    • Contributors
    • About Us
    • Colophon
    • Survey
  • Reliability.fm
  • Articles
    • CRE Preparation Notes
    • NoMTBF
    • on Leadership & Career
      • Advanced Engineering Culture
      • ASQR&R
      • Engineering Leadership
      • Managing in the 2000s
      • Product Development and Process Improvement
    • on Maintenance Reliability
      • Aasan Asset Management
      • AI & Predictive Maintenance
      • Asset Management in the Mining Industry
      • CMMS and Maintenance Management
      • CMMS and Reliability
      • Conscious Asset
      • EAM & CMMS
      • Everyday RCM
      • History of Maintenance Management
      • Life Cycle Asset Management
      • Maintenance and Reliability
      • Maintenance Management
      • Plant Maintenance
      • Process Plant Reliability Engineering
      • RCM Blitz®
      • ReliabilityXperience
      • Rob’s Reliability Project
      • The Intelligent Transformer Blog
      • The People Side of Maintenance
      • The Reliability Mindset
    • on Product Reliability
      • Accelerated Reliability
      • Achieving the Benefits of Reliability
      • Apex Ridge
      • Field Reliability Data Analysis
      • Metals Engineering and Product Reliability
      • Musings on Reliability and Maintenance Topics
      • Product Validation
      • Reliability by Design
      • Reliability Competence
      • Reliability Engineering Insights
      • Reliability in Emerging Technology
      • Reliability Knowledge
    • on Risk & Safety
      • CERM® Risk Insights
      • Equipment Risk and Reliability in Downhole Applications
      • Operational Risk Process Safety
    • on Systems Thinking
      • Communicating with FINESSE
      • The RCA
    • on Tools & Techniques
      • Big Data & Analytics
      • Experimental Design for NPD
      • Innovative Thinking in Reliability and Durability
      • Inside and Beyond HALT
      • Inside FMEA
      • Institute of Quality & Reliability
      • Integral Concepts
      • Learning from Failures
      • Progress in Field Reliability?
      • R for Engineering
      • Reliability Engineering Using Python
      • Reliability Reflections
      • Statistical Methods for Failure-Time Data
      • Testing 1 2 3
      • The Manufacturing Academy
  • eBooks
  • Resources
    • Accendo Authors
    • FMEA Resources
    • Glossary
    • Feed Forward Publications
    • Openings
    • Books
    • Webinar Sources
    • Podcasts
  • Courses
    • Your Courses
    • Live Courses
      • Introduction to Reliability Engineering & Accelerated Testings Course Landing Page
      • Advanced Accelerated Testing Course Landing Page
    • Integral Concepts Courses
      • Reliability Analysis Methods Course Landing Page
      • Applied Reliability Analysis Course Landing Page
      • Statistics, Hypothesis Testing, & Regression Modeling Course Landing Page
      • Measurement System Assessment Course Landing Page
      • SPC & Process Capability Course Landing Page
      • Design of Experiments Course Landing Page
    • The Manufacturing Academy Courses
      • An Introduction to Reliability Engineering
      • Reliability Engineering Statistics
      • An Introduction to Quality Engineering
      • Quality Engineering Statistics
      • FMEA in Practice
      • Process Capability Analysis course
      • Root Cause Analysis and the 8D Corrective Action Process course
      • Return on Investment online course
    • Industrial Metallurgist Courses
    • FMEA courses Powered by The Luminous Group
    • Foundations of RCM online course
    • Reliability Engineering for Heavy Industry
    • How to be an Online Student
    • Quondam Courses
  • Calendar
    • Call for Papers Listing
    • Upcoming Webinars
    • Webinar Calendar
  • Login
    • Member Home
  • Barringer Process Reliability Introduction Course Landing Page
  • Upcoming Live Events
You are here: Home / Articles / Using Contour Plots in RCAs

by André-Michel Ferrari Leave a Comment

Using Contour Plots in RCAs

Root Cause Analysis Overview

A Root Cause Analysis (RCA) is a structured approach to identifying the underlying factors that result in the unwanted/unexpected outcomes of chronic or sporadic events. It is a highly methodic and rigorous process. And highlights what assets, systems or behaviors need to be modified in order to to limit or eliminate the recurrence of similar outcomes. The fundamental driver is to address, correct or mitigate the root causes that lead to the unwanted event rather than addressing the symptoms. Bob Latino, a renowned RCA expert, summarizes this concept as “the establishing of logically complete, evidence based, tightly coupled chains of factors from the least acceptable consequences to the deepest significant underlying causes.”

RCAs are extremely informative and value-added exercises. They can stand out as “learning moments” for an entire organization. But their “depth” causes them to be work intensive. With limited resources in every organization, the initiation of an RCA should be carefully evaluated and prioritized. Due to their methodological rigor, RCAs require thorough investigations and “deep dives” into the failure mechanisms leading to the physical root cause(s). The methodology allows for hypotheses to be considered and analyzed. And subsequently validated. If deemed valid, they are retained and if incorrect, not pursued. A typical RCA block can have multiple hypotheses derived. As shown in Diagram 1 below. The reason why we obtain multiple hypotheses is because we ask the question “how can this happen?” rather than “how did this occur?“. This is also why we commonly obtain branched and complex RCA logic trees. Contrary to linear ones like the 5 Why’s.

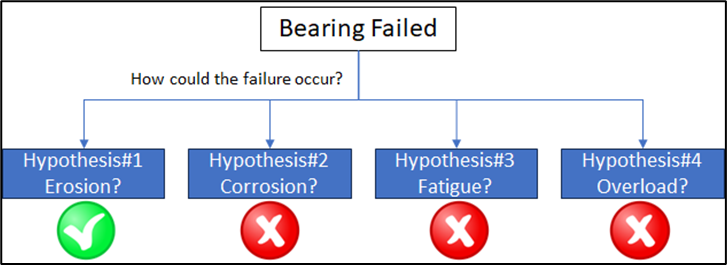
For example, in a mechanical failure process (e.g. bearing failure), the typical hypothesis layout would be as follows:

  • Question: How can a bearing failure occur?
  • Hypothesis 1 – Failure caused by Erosion.
  • Hypothesis 2 – Failure caused by Corrosion.
  • Hypothesis 3 – Failure caused by Fatigue.
  • Hypothesis 4 – Failure caused by Overload.

These 4 failure mechanisms are well documented in a Reliamag article written again by Bob Latino.  

A graphic showing four hypotheses for a bearing failure, including erosion, corrosion, fatigue, and overload.
Diagram 1 – Illustration of RCA Logic Tree branching due to hypothesis consideration including final validation.

The 4 hypotheses identified in Diagram 1 would require validation. This would require tests or expert inputs. In addition, Reliability Engineering techniques can contribute to the validation process as shown next.

Using Reliability Engineering based Contour Plots for Hypothesis Validation.

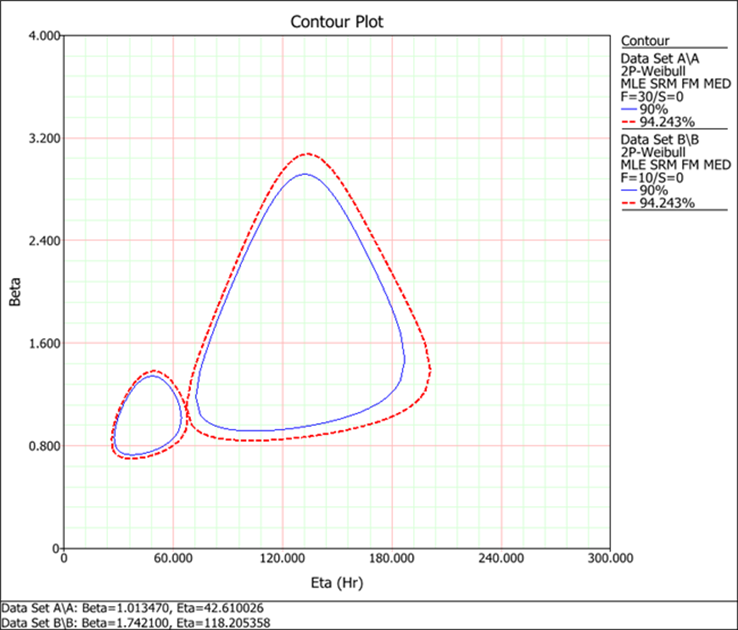
In Reliability Analytics, Contour Plots are used to identify statistically significant differences between two or more life distributions. The plot is a visual representation of the variation of distributions parameters as shown in Graph 1 below.

When studying failure mechanisms in Reliability Engineering, we typically build statistical models to represent the life characteristics of different failed components. For example, if we are evaluating pump life characteristics, we would build failure models for critical components such as bearings, mechanical seals, shafts etc. Each life distribution would have a Contour Plot associated with it.  The final graph with the multiple contours representing each failure mode is used to test for statistically significant differences between those modes. If there is no overlap in the contours, then there is a statistically significant difference between the distributions. In practical terms this means that the modes are independent; one failure mode does not cause the other one to occur.

In the example below, we illustrate Contour Plots for two data sets at two confidence levels of 90% and 94.23%. At the 90% level (blue lines), the two data sets do not overlap hence are statistically different.  The opposite occurs at confidence level 94.23%.

a contour plot showing two datasets of data, a and b, with mutually exclusive areas outlined when plotting beta and eta values
Graph 1 – Example of Contour Plots for two statistical models (Source – Reliasoft Contour Plots)

Practical Application of Contour Plots in an Electrical Motor RCA

In the simplified example below, we are looking at validating a hypothesis in an RCA logic tree. This new hypothesis relates to: what causes a Bearing to erode in an Electric Motor assembly? Going back to Diagram 1 above, we have confirmed through hypothesis validation, that erosion is the failure mechanism of the Bearing. Now the question is: how can this erosion occur?

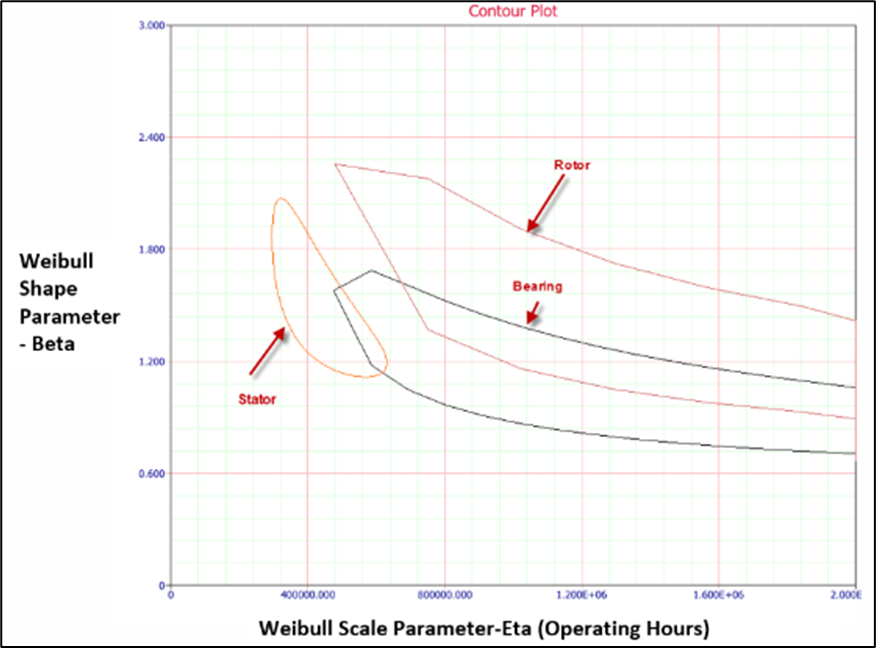
According to Computer Maintenance Management (CMMS) records and our Reliability studies, the common failure modes highlighted with regards to this specific Electric Motor amount to three: Stator, Bearing and Rotor failures. So, a Bearing failure could be caused hypothetically by both Stator or Rotor failure.

The corresponding Contour Plot graph is illustrated in Graph 2 below. Based on the overlaps of the Contour Plots, the following findings come to light:

  • Since the Bearing plot overlaps with both Rotor and Stator plots, this implies that the Bearing failure is connected to both. In other words, both the Stator and Rotor failures can cause a Bearing failure.
  • The Rotor and Stator failures are statistically independent. The failure of one does not impact the other. This is extra information we have gathered from this Contour Plot analysis.
Electrical Motor Contour Plot for Rotor, Stator and Bearing failures. contours do overlap slightly
Graph 2 – Electrical Motor Contour Plot for Rotor, Stator and Bearing failures.

The RCA is not quite finished at this stage because the team now has to investigate further in terms of what is the dominant physical cause of Bearing failure, i.e. Stator or Rotor?  However, we know that both need to be investigated.

The important learning obtained here is that Contour Plots can help guide an RCA process especially in terms of hypothesis validation. This also implies that Reliability Engineers can have a pertinent contribution to the RCA process For this, failure records ought to be rigorously collected and maintained. And if done, ongoing life analysis conducted with those same records.

Filed Under: Articles, on Maintenance Reliability, The Reliability Mindset

About André-Michel Ferrari

André-Michel Ferrari is a Reliability Engineer who specializes in Reliability Analytics and Modeling which are fundamental to improving asset performance and output in industrial operations.

André-Michel has approximately 30 years of industrial experience mainly in Reliability Engineering, Maintenance Engineering, and Quality Systems Implementation. His experience includes world-class companies in the Brewing, Semiconductor, and Oil & Gas industries in Africa, Europe and North America.

« The Army Memo to Stop Using Mil HDBK 217
Educating Leadership on the Value of Asset Management »

Leave a Reply Cancel reply

Your email address will not be published. Required fields are marked *

The Reliability Mindset logo Photo of André-Michel FerrariArticles by André-Michel Ferrari
in the The Reliability Mindset: Practical Applications in Industry article series

Join Accendo

Receive information and updates about articles and many other resources offered by Accendo Reliability by becoming a member.

It’s free and only takes a minute.

Join Today

Recent Posts

  • Gremlins today
  • The Power of Vision in Leadership and Organizational Success
  • 3 Types of MTBF Stories
  • ALT: An in Depth Description
  • Project Email Economics

© 2025 FMS Reliability · Privacy Policy · Terms of Service · Cookies Policy