Accendo Reliability

Your Reliability Engineering Professional Development Site

  • Home
  • About
    • Contributors
    • About Us
    • Colophon
    • Survey
  • Reliability.fm
  • Articles
    • CRE Preparation Notes
    • NoMTBF
    • on Leadership & Career
      • Advanced Engineering Culture
      • ASQR&R
      • Engineering Leadership
      • Managing in the 2000s
      • Product Development and Process Improvement
    • on Maintenance Reliability
      • Aasan Asset Management
      • AI & Predictive Maintenance
      • Asset Management in the Mining Industry
      • CMMS and Maintenance Management
      • CMMS and Reliability
      • Conscious Asset
      • EAM & CMMS
      • Everyday RCM
      • History of Maintenance Management
      • Life Cycle Asset Management
      • Maintenance and Reliability
      • Maintenance Management
      • Plant Maintenance
      • Process Plant Reliability Engineering
      • RCM Blitz®
      • ReliabilityXperience
      • Rob’s Reliability Project
      • The Intelligent Transformer Blog
      • The People Side of Maintenance
      • The Reliability Mindset
    • on Product Reliability
      • Accelerated Reliability
      • Achieving the Benefits of Reliability
      • Apex Ridge
      • Field Reliability Data Analysis
      • Metals Engineering and Product Reliability
      • Musings on Reliability and Maintenance Topics
      • Product Validation
      • Reliability by Design
      • Reliability Competence
      • Reliability Engineering Insights
      • Reliability in Emerging Technology
      • Reliability Knowledge
    • on Risk & Safety
      • CERM® Risk Insights
      • Equipment Risk and Reliability in Downhole Applications
      • Operational Risk Process Safety
    • on Systems Thinking
      • Communicating with FINESSE
      • The RCA
    • on Tools & Techniques
      • Big Data & Analytics
      • Experimental Design for NPD
      • Innovative Thinking in Reliability and Durability
      • Inside and Beyond HALT
      • Inside FMEA
      • Institute of Quality & Reliability
      • Integral Concepts
      • Learning from Failures
      • Progress in Field Reliability?
      • R for Engineering
      • Reliability Engineering Using Python
      • Reliability Reflections
      • Statistical Methods for Failure-Time Data
      • Testing 1 2 3
      • The Manufacturing Academy
  • eBooks
  • Resources
    • Accendo Authors
    • FMEA Resources
    • Glossary
    • Feed Forward Publications
    • Openings
    • Books
    • Webinar Sources
    • Podcasts
  • Courses
    • Your Courses
    • Live Courses
      • Introduction to Reliability Engineering & Accelerated Testings Course Landing Page
      • Advanced Accelerated Testing Course Landing Page
    • Integral Concepts Courses
      • Reliability Analysis Methods Course Landing Page
      • Applied Reliability Analysis Course Landing Page
      • Statistics, Hypothesis Testing, & Regression Modeling Course Landing Page
      • Measurement System Assessment Course Landing Page
      • SPC & Process Capability Course Landing Page
      • Design of Experiments Course Landing Page
    • The Manufacturing Academy Courses
      • An Introduction to Reliability Engineering
      • Reliability Engineering Statistics
      • An Introduction to Quality Engineering
      • Quality Engineering Statistics
      • FMEA in Practice
      • Process Capability Analysis course
      • Root Cause Analysis and the 8D Corrective Action Process course
      • Return on Investment online course
    • Industrial Metallurgist Courses
    • FMEA courses Powered by The Luminous Group
    • Foundations of RCM online course
    • Reliability Engineering for Heavy Industry
    • How to be an Online Student
    • Quondam Courses
  • Calendar
    • Call for Papers Listing
    • Upcoming Webinars
    • Webinar Calendar
  • Login
    • Member Home
  • Barringer Process Reliability Introduction Course Landing Page
  • Upcoming Live Events
You are here: Home / Articles / Use An Isocorrosion Diagram To Recognize High Corrosion Situations

by Mike Sondalini Leave a Comment

Use An Isocorrosion Diagram To Recognize High Corrosion Situations

Use An Isocorrosion Diagram To Recognize High Corrosion Situations

Use an Isocorrosion Diagrams To Recognise High Corrosion Situations And Design Process Equipment Accordingly. A true story of how a high nickel alloy (Alloy 28) reactor was holed in 8 weeks by sulphuric (sulfuric) acid running down the inside wall. When the situation was reviewed in detail using an iso-corrosion diagram for the alloy in sulphuric acid it was obvious that such a problem would occur. The iso-corrosion curves clearly showed the huge corrosion rates that would happen at local contact points within the reactor. A clear and detailed understanding of how to use iso-corrosion curves would have highlighted the problem at the design stage.

Keywords: corrosion rate, corrosion resistance, iso-corrosion curve, iso-corrosion diagram, nickel alloy corrosion

Explanation:

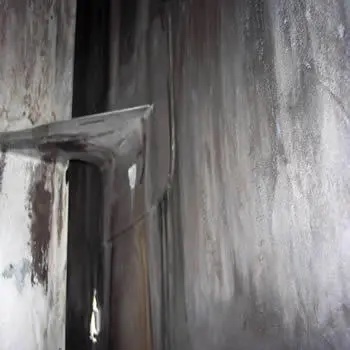
Below is a picture of the inside of an agitated Alloy 28 reactor showing a baffle mounted-off compensating plates. At the bottom of the picture you will notice a hole in the wall. Midway, the gusset has been thinned to razor sharp edges. Further up near the top is signs of corrosion on the compensating plate. The 5 mm thick wall was corroded in 8 weeks by sulphuric acid running down the baffle and wall.

The sulphuric acid was typically at 80% concentration and 20C at the injection point in the roof. No detrimental contaminants were present. When you look at the corrosion data for 80% sulphuric acid and 20C conditions it can be stored in a thick walled carbon steel tank with only minor metal loss. However as soon as the acid is diluted, or increases in temperature, or is aerated and receives more oxygen, or is contaminated by chlorides, then the corrosion rates skyrocket.

These sudden changes in the corrosion resistance of metals is best seen on an isocorrosion diagram showing iso-corrosion curves for different chemical strengths and equipment service environments. A stylised sketch of an iso-corrosion chart is shown below. Usually the data for the curves are developed from laboratory tests and as such are only indicative of real-world situations. The curves on the diagram show the conditions at which the amount of metal loss is the same.

A family of curves provide much better appreciation of the effect of changed conditions than just one curve. Sometimes it is necessary to superimpose data from several sources onto the one chart in order to build the family of iso-corrosion curves for yourself. The corrosion rates can rise fantastically with only a small change in temperature, concentration or contaminants.

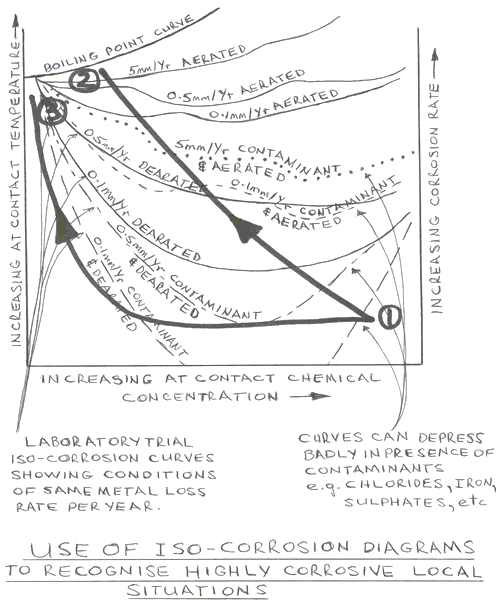
What is important is to see what happens as the chemical concentration changes AND as the temperature changes AND as the availability of oxygen changes AND as the concentration of contaminants change … all at the same time.

Going back to the Alloy 28 reactor in which sulphuric acid was injected into a slurry of powder and water we can trace what happened to the corrosion chemistry on the isocorrosion diagram.

The sulphuric acid was added at high strength and low temperature when it first hit the wall (Point 1). When the main sulphuric acid stream contacted the water slurry a great amount of heat was generated. Within the reactor the bulk liquid temperature rapidly climbed to 120C and a great amount of steam was generated. The reactor was agitated to insure homogeneous acid mixing and temperature throughout the bulk liquid.

The acid that hit the wall and baffle ran down the surface of the alloy. As it ran down the acid continually absorbed moisture from the steam cloud in the reactor and diluted rapidly. The heat from the reaction radiated the tank walls warming them up. The lower part of the wall was also heated from the bulk liquid 120C temperature and conducted up the wall. All the while the thin streams of acid on the wall were now covering a relatively big surface area compared to the thin stream volume. The falling acid was directly exposed to oxygen in the air by the great billowing volumes of surging hot mist.

On the isocorrosion diagram you can see that the corrosion conditions on the reactor wall rapidly deteriorated in seconds and became terribly aggressive. All the worst conditions (Point 2) were at the lower part of the reactor where the hole developed.

To truly understand the real localised corrosion effects of chemicals on alloy metals it is necessary to develop an isocorrosion diagram of the worst conditions to be experienced. Once the worst local conditions are known the correct alloy with the best properties can be chosen. And/or the reactor redesigned to insure no harmful conditions are possible.

The problem was solved by simply moving the injection nozzle toward the center of the reactor. Once the massive corrosion rates caused by direct contact of acid on alloy were recognised, it was clear that if the acid was to first contact the bulk liquid and dilute in the bulk liquid, then the resulting acid concentration would have negligible effect on the alloy. This changed approach is shown by curve 3.

Disclaimer: Because the authors, publisher and resellers do not know the context in which the information presented in this article is to be used they accept no responsibility for the consequences of using the information contained or implied in any articles.

Filed Under: Articles, on Maintenance Reliability, Plant Maintenance

About Mike Sondalini

In engineering and maintenance since 1974, Mike’s career extends across original equipment manufacturing, beverage processing and packaging, steel fabrication, chemical processing and manufacturing, quality management, project management, enterprise asset management, plant and equipment maintenance, and maintenance training. His specialty is helping companies build highly effective operational risk management processes, develop enterprise asset management systems for ultra-high reliable assets, and instil the precision maintenance skills needed for world class equipment reliability.

« About Agile 2
Maintenance – Necessary Evil or Value Creator? »

Leave a Reply Cancel reply

Your email address will not be published. Required fields are marked *

Article by
Mike Sondalini
in the
Plant Maintenance series.

Join Accendo

Receive information and updates about articles and many other resources offered by Accendo Reliability by becoming a member.

It’s free and only takes a minute.

Join Today

Recent Articles

  • Gremlins today
  • The Power of Vision in Leadership and Organizational Success
  • 3 Types of MTBF Stories
  • ALT: An in Depth Description
  • Project Email Economics

© 2025 FMS Reliability · Privacy Policy · Terms of Service · Cookies Policy