Accendo Reliability

Your Reliability Engineering Professional Development Site

  • Home
  • About
    • Contributors
    • About Us
    • Colophon
    • Survey
  • Reliability.fm
  • Articles
    • CRE Preparation Notes
    • NoMTBF
    • on Leadership & Career
      • Advanced Engineering Culture
      • ASQR&R
      • Engineering Leadership
      • Managing in the 2000s
      • Product Development and Process Improvement
    • on Maintenance Reliability
      • Aasan Asset Management
      • AI & Predictive Maintenance
      • Asset Management in the Mining Industry
      • CMMS and Maintenance Management
      • CMMS and Reliability
      • Conscious Asset
      • EAM & CMMS
      • Everyday RCM
      • History of Maintenance Management
      • Life Cycle Asset Management
      • Maintenance and Reliability
      • Maintenance Management
      • Plant Maintenance
      • Process Plant Reliability Engineering
      • RCM Blitz®
      • ReliabilityXperience
      • Rob’s Reliability Project
      • The Intelligent Transformer Blog
      • The People Side of Maintenance
      • The Reliability Mindset
    • on Product Reliability
      • Accelerated Reliability
      • Achieving the Benefits of Reliability
      • Apex Ridge
      • Field Reliability Data Analysis
      • Metals Engineering and Product Reliability
      • Musings on Reliability and Maintenance Topics
      • Product Validation
      • Reliability by Design
      • Reliability Competence
      • Reliability Engineering Insights
      • Reliability in Emerging Technology
      • Reliability Knowledge
    • on Risk & Safety
      • CERM® Risk Insights
      • Equipment Risk and Reliability in Downhole Applications
      • Operational Risk Process Safety
    • on Systems Thinking
      • Communicating with FINESSE
      • The RCA
    • on Tools & Techniques
      • Big Data & Analytics
      • Experimental Design for NPD
      • Innovative Thinking in Reliability and Durability
      • Inside and Beyond HALT
      • Inside FMEA
      • Institute of Quality & Reliability
      • Integral Concepts
      • Learning from Failures
      • Progress in Field Reliability?
      • R for Engineering
      • Reliability Engineering Using Python
      • Reliability Reflections
      • Statistical Methods for Failure-Time Data
      • Testing 1 2 3
      • The Manufacturing Academy
  • eBooks
  • Resources
    • Accendo Authors
    • FMEA Resources
    • Glossary
    • Feed Forward Publications
    • Openings
    • Books
    • Webinar Sources
    • Podcasts
  • Courses
    • Your Courses
    • Live Courses
      • Introduction to Reliability Engineering & Accelerated Testings Course Landing Page
      • Advanced Accelerated Testing Course Landing Page
    • Integral Concepts Courses
      • Reliability Analysis Methods Course Landing Page
      • Applied Reliability Analysis Course Landing Page
      • Statistics, Hypothesis Testing, & Regression Modeling Course Landing Page
      • Measurement System Assessment Course Landing Page
      • SPC & Process Capability Course Landing Page
      • Design of Experiments Course Landing Page
    • The Manufacturing Academy Courses
      • An Introduction to Reliability Engineering
      • Reliability Engineering Statistics
      • An Introduction to Quality Engineering
      • Quality Engineering Statistics
      • FMEA in Practice
      • Process Capability Analysis course
      • Root Cause Analysis and the 8D Corrective Action Process course
      • Return on Investment online course
    • Industrial Metallurgist Courses
    • FMEA courses Powered by The Luminous Group
    • Foundations of RCM online course
    • Reliability Engineering for Heavy Industry
    • How to be an Online Student
    • Quondam Courses
  • Calendar
    • Call for Papers Listing
    • Upcoming Webinars
    • Webinar Calendar
  • Login
    • Member Home
  • Barringer Process Reliability Introduction Course Landing Page
  • Upcoming Live Events
You are here: Home / Articles / The Ubiquitous Normal Distribution

by Ray Harkins Leave a Comment

The Ubiquitous Normal Distribution

The Ubiquitous Normal Distribution

Underpinning the coherence of statistical process control, process capability analysis and numerous other statistical applications is a phenomenon found throughout nature, the social sciences, athletics, academics and more. That is, the normal distribution, or less formally, the bell curve. Because of its ubiquity, this normal distribution is arguably the most important data model analysts, engineers, or quality professionals will learn.

The normal distribution is a type of frequency distribution characterized by its bell shape—that is, symmetrical about its average value with a decreasing probability of occurrence at its extreme values. Consider for a moment Figures 10 and 11. Both roughly display this bell shape, yet the sources of their data are vastly different.

3

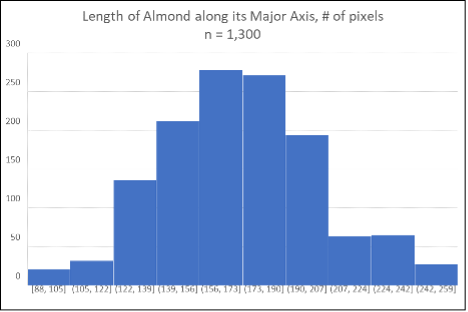
Figure 10 is a histogram showing the frequency distribution of the weights of professional National Basketball Association players during the 2023-2024 season. This data may useful to professional coaches, aspiring players, athletic trainers, recruiters, and sports enthusiasts. The histogram in Figure 11 displays the distribution of the lengths of a 1,300-piece sample of randomly selected California almonds, as measured by a machine vision system and image processing software. This analysis is useful to a mere handful of agronomists and automated nut-cracking machine design engineers. 

So how can the histograms of these very different populations look so similar? The answer is rooted in a statistical law called the Central Limit Theorem, which states that when you take a large number of independent events or data points and combine them, their average will tend to form a normal distribution, regardless of the original distribution of the individual events.

Imagine you’re building a mountain of sand by dropping thousands of tiny grains from above. Each grain might fall in a slightly different spot, but as you keep dropping more grains, the shape of the mountain starts to look the same every time—rounded and symmetrical, with most of the sand piling up in the middle and tapering off evenly on both sides.

This is similar to how the normal distribution works. Even if the individual events (like the path of a grain of sand) are different and somewhat random, when you look at the big picture, the combined result tends to form a bell-shaped curve.

The normal distribution shows up in many different situations because many processes are the result of adding up small, independent factors. Whether it’s the height of people, the length of almonds, or the variation in a manufacturing process, these are all influenced by multiple small, random effects. When these effects are combined, the outcome is often a normal distribution.

So, even though the events themselves might be different, the way they combine leads to that familiar bell curve, making the normal distribution a common pattern in the natural world and in human-made processes.

Ray Harkins is the General Manager of Lexington Technologies in Lexington, North Carolina. He earned his Master of Science from Rochester Institute of Technology and his Master of Business Administration from Youngstown State University. He also teaches manufacturing and business-related skills such as Quality Engineering Statistics, Reliability Engineering Statistics, Failure Modes and Effects Analysis (FMEA), and Root Cause Analysis and the 8D Corrective Action Process through the online learning platform, Udemy. He can be reached via LinkedIn at linkedin.com/in/ray-harkins or by email at the.mfg.acad@gmail.com.

[display_form id=362]

Filed Under: Articles, on Tools & Techniques, The Manufacturing Academy Tagged With: Statistics distributions and functions

About Ray Harkins

Ray Harkins is a senior manufacturing professional with over 25 years of experience in manufacturing engineering, quality management, and business analysis.

During his career, he has toured hundreds of manufacturing facilities and worked with leading industry professionals throughout North America and Japan.

« Introduction to the t-test
Opportunities for Maintenance and Operations: Balanced Air »

Leave a Reply Cancel reply

Your email address will not be published. Required fields are marked *

Logo for The Manufacturing Acadamey headshot of RayArticle by Ray Harkins
in the The Manufacturing Academy article series

Join Accendo

Receive information and updates about articles and many other resources offered by Accendo Reliability by becoming a member.

It’s free and only takes a minute.

Join Today

Recent Posts

  • Gremlins today
  • The Power of Vision in Leadership and Organizational Success
  • 3 Types of MTBF Stories
  • ALT: An in Depth Description
  • Project Email Economics

© 2025 FMS Reliability · Privacy Policy · Terms of Service · Cookies Policy