
Introducing the “Bath Tub” curve concept
In the Reliability and Maintenance world, we often refer to what is known as the “bathtub” curve and ask the question: “What is the bathtub curve for this equipment?” The name “bathtub” comes from the equipment failure rate curve resembling a sanitary bathtub’s longitudinal section. In reality, it is rarely symmetrical and looks more like a distorted “u” or “v” shaped figure. The bathtub curve can be useful in various circumstances and help an operator better manage their assets over time. However, it is important to understand where it comes from and what it means so we can avoid misusing or misinterpreting it.
The bathtub curve is constructed using Weibull distributions and is essentially made up of three distributions as illustrated in Diagram 1 below. The Greek letter Beta (β) indicates the relative value of the Weibull distribution shape parameter.

Interpreting the various sections
The leftmost section, or β < 1 is known as the infant mortality section. The failure rate, as represented in Diagram 1 above, decreases over time. This corresponds to early failures, which are undesirable. Infant mortality represents premature failures due to manufacturing defects or inadequate maintenance practices. Those failures are best addressed by a root cause analysis (RCA) process. The middle section, or β = 1, is called the random failure section. The failure rate, as represented in Diagram 1, is constant. Failures occur at random and appear to be influenced by external factors rather than the degradation of the asset itself.
From a maintenance standpoint, this section is extremely difficult to manage. Preventive maintenance or proactive repairs are not effective, and contingency plans like readily available spares are often the best strategy. As with infant mortality, this interval is equally undesirable. The rightmost section, or β > 1, is called the aging or wear-out section. The failure rate, as represented in Diagram 1 above, increases over time. This corresponds to the time in the life of an asset where age-related failures appear and increase over time. The use of the asset over time generates deterioration leading to an increase in repair frequency and subsequently an increase in the cost of maintenance. This section offers a predictable failure pattern over time and can be managed by a variety of maintenance tasks. In an ideal world, all assets should have an aging failure rate so that financial and other resources can be planned and allocated for the medium and long term, including end-of-life replacement.
Analysis of a “Bath Tub” curve example
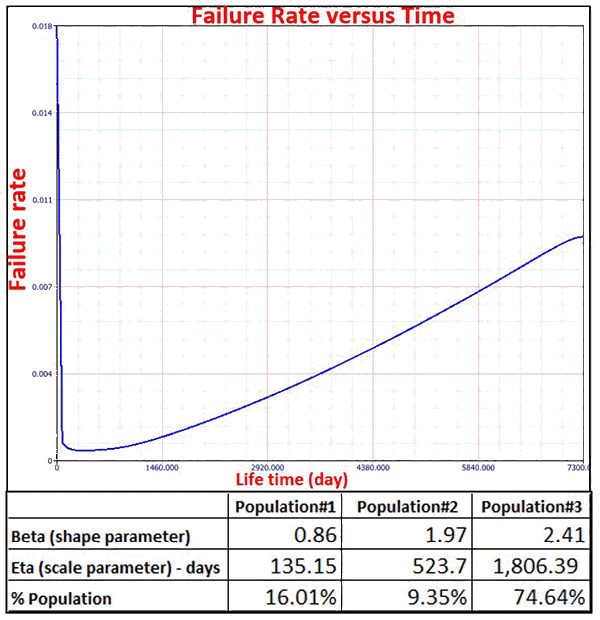
Diagram 2 above illustrates a “real-life” bathtub curve, highlighting its asymmetrical nature. Using specialized software, one can allocate the Weibull distribution parameters (scale and shape parameter) and weight (i.e., population percentage) of each section of the curve, and this is where information about the asset gets interesting. In the Diagram 2 example, we have three sections: one section showing infant mortality but no section showing random failures. Instead, we have two aging sections (i.e., population 2 and 3). The weight of each section refers to the number of data points that make up this section in proportion to the total number of data points. In other words, it represents the “influence” of this section relative to the entire population. For example, in our Diagram 2 example, infant mortality has a rather small influence on the failures in the asset studied here (16% weight). The life of the asset is predominantly influenced by failures due to aging, i.e., 84% of the entire population weight. This means that aging is the dominant failure pattern for this component. Infant mortality still accounts for 16%, which could still be a significant issue for the operator. If so, an investigation should be conducted (e.g., root cause analysis) to identify why these undesirable early events are occurring. The other information available from this curve is obtained from the scale parameter (eta) value. Before 135 days, we can expect infant mortality-related failures to occur, whereas past this time limit, failures are governed by degradation mechanisms and increasing in frequency over time.
In conclusion, knowing how to build a bathtub curve and interpret its output can have significant benefits for an asset operator.

As a former Manufacturing Manager, I am familiar with the ‘bathtub curve’ as reflecting ‘failure rate analysis’, where early failures are more prevalent in the early stages of a product and again at the end of the product life-cycle.
I am less familiar with its use in a sales environment. A colleague has recently suggested “the “bathtub curve” concept often applies to sales as well. They (sales) either come at the beginning of the cycle or at the end, with a long plateau in the middle. The keenest people booked when it first went on sale.
This is in relation to booking for an event, with early ticket sales being high, then flattening off, only to increase again as the event approaches.
While it sounds plausible, is there any evidence to support this? I suspect it may be more true of products, or services, with a long life-cycle, where ‘early adopters’ cause high early levels of sale, then sales settle down and finally, there may be an ‘uptick’ in sales shortly before the item is withdrawn, or the date of the event approaches.
This is a great question, Julius. Thanks for your interest in my article. I have never seen this concept (i.e. bathtub curve for sales) applied. However, I am not one to shy away from exploring this. After all, statistics are not only limited to the field of Reliability Engineering. I am guessing if your colleague had some data on the subject this would be a neat little project to pursue. The data I would look for is: time to time sale from time tickets were first issued to the public. Let me know if this makes sense.