Accendo Reliability

Your Reliability Engineering Professional Development Site

  • Home
  • About
    • Contributors
    • About Us
    • Colophon
    • Survey
  • Reliability.fm
  • Articles
    • CRE Preparation Notes
    • NoMTBF
    • on Leadership & Career
      • Advanced Engineering Culture
      • ASQR&R
      • Engineering Leadership
      • Managing in the 2000s
      • Product Development and Process Improvement
    • on Maintenance Reliability
      • Aasan Asset Management
      • AI & Predictive Maintenance
      • Asset Management in the Mining Industry
      • CMMS and Maintenance Management
      • CMMS and Reliability
      • Conscious Asset
      • EAM & CMMS
      • Everyday RCM
      • History of Maintenance Management
      • Life Cycle Asset Management
      • Maintenance and Reliability
      • Maintenance Management
      • Plant Maintenance
      • Process Plant Reliability Engineering
      • RCM Blitz®
      • ReliabilityXperience
      • Rob’s Reliability Project
      • The Intelligent Transformer Blog
      • The People Side of Maintenance
      • The Reliability Mindset
    • on Product Reliability
      • Accelerated Reliability
      • Achieving the Benefits of Reliability
      • Apex Ridge
      • Field Reliability Data Analysis
      • Metals Engineering and Product Reliability
      • Musings on Reliability and Maintenance Topics
      • Product Validation
      • Reliability by Design
      • Reliability Competence
      • Reliability Engineering Insights
      • Reliability in Emerging Technology
      • Reliability Knowledge
    • on Risk & Safety
      • CERM® Risk Insights
      • Equipment Risk and Reliability in Downhole Applications
      • Operational Risk Process Safety
    • on Systems Thinking
      • Communicating with FINESSE
      • The RCA
    • on Tools & Techniques
      • Big Data & Analytics
      • Experimental Design for NPD
      • Innovative Thinking in Reliability and Durability
      • Inside and Beyond HALT
      • Inside FMEA
      • Institute of Quality & Reliability
      • Integral Concepts
      • Learning from Failures
      • Progress in Field Reliability?
      • R for Engineering
      • Reliability Engineering Using Python
      • Reliability Reflections
      • Statistical Methods for Failure-Time Data
      • Testing 1 2 3
      • The Manufacturing Academy
  • eBooks
  • Resources
    • Accendo Authors
    • FMEA Resources
    • Glossary
    • Feed Forward Publications
    • Openings
    • Books
    • Webinar Sources
    • Podcasts
  • Courses
    • Your Courses
    • Live Courses
      • Introduction to Reliability Engineering & Accelerated Testings Course Landing Page
      • Advanced Accelerated Testing Course Landing Page
    • Integral Concepts Courses
      • Reliability Analysis Methods Course Landing Page
      • Applied Reliability Analysis Course Landing Page
      • Statistics, Hypothesis Testing, & Regression Modeling Course Landing Page
      • Measurement System Assessment Course Landing Page
      • SPC & Process Capability Course Landing Page
      • Design of Experiments Course Landing Page
    • The Manufacturing Academy Courses
      • An Introduction to Reliability Engineering
      • Reliability Engineering Statistics
      • An Introduction to Quality Engineering
      • Quality Engineering Statistics
      • FMEA in Practice
      • Process Capability Analysis course
      • Root Cause Analysis and the 8D Corrective Action Process course
      • Return on Investment online course
    • Industrial Metallurgist Courses
    • FMEA courses Powered by The Luminous Group
    • Foundations of RCM online course
    • Reliability Engineering for Heavy Industry
    • How to be an Online Student
    • Quondam Courses
  • Calendar
    • Call for Papers Listing
    • Upcoming Webinars
    • Webinar Calendar
  • Login
    • Member Home
  • Barringer Process Reliability Introduction Course Landing Page
  • Upcoming Live Events
You are here: Home / Archives for Statistical Process Control (SPC)

Articles tagged Statistical Process Control (SPC)

The set of activities using statistical techniques to reduce variation, increase knowledge of the process, and direct the process in a desired manner. SPC is often associated with control charting and provides a means to identify and minimize unwanted process variation and maintain process stability.

by JD Solomon Leave a Comment

Using Statistical Process Control in Environmental Root Cause Analysis

Using Statistical Process Control in Environmental Root Cause Analysis

We often jump to the wrong conclusions when non-compliance occurs. Non-compliance occurs when the standards and regulations designed to protect public health and the environment are unmet. Obviously, we must reduce immediate risks. However, these measures often address the symptoms and not the root causes. This leads to further delays or doubling down on the wrong things as we move through mitigation that misses the mark. Using statistical process control in environmental root cause analysis is one way to make sure you’re getting it right!

[Read more…]

Filed Under: Articles, Communicating with FINESSE, on Systems Thinking Tagged With: compliance, environmental failure, Root Cause Analysis (RCA), Statistical Process Control (SPC)

by Christopher Jackson 2 Comments

Manufacturing notes – what is Statistical Process Control (SPC)?

Manufacturing notes – what is Statistical Process Control (SPC)?

If you have ever been involved in manufacturing or quality-related conversations, you may have heard of ‘Statistical Process Control’ or SPC. And if you Google SPC you will find a bunch of ‘textbooky’ definitions which are likely going to make you run away and never think of it again.

But you shouldn’t. [Read more…]

Filed Under: Articles, on Product Reliability, Reliability in Emerging Technology Tagged With: Statistical Process Control (SPC)

by Steven Wachs Leave a Comment

What is the Philosophy of Process Control?

What is the Philosophy of Process Control?

Ask people involved with the design and manufacture of a product the following question:  “What is Quality?”  Many if not most of the responses will be some form of the following:  “Quality is ensuring that our products meet the customer (or engineering) specifications.  Unfortunately, this leads to a “conformance to specifications” or a “Product Control” approach to quality. [Read more…]

Filed Under: Articles, Integral Concepts, on Tools & Techniques Tagged With: Statistical Process Control (SPC)

by Dennis Craggs 3 Comments

When should SPC be used?

When should SPC be used?

Introduction

Many companies use SPC to control their manufacturing and assembly processes. Other companies use 100% inspection and some companies do nothing. How can one choose between these three alternatives?

To make a rational choice, some questions need to be answered.

  • What are the costs of internal and external failure on similar product?
  • Is the product design and/or process flow new, modified or carryover?
  • Are critical characteristics for the part and process known?
  • Are the process capabilities known?

[Read more…]

Filed Under: Articles, Big Data & Analytics, on Tools & Techniques Tagged With: Process capability, Statistical Process Control (SPC)

by Dennis Craggs 3 Comments

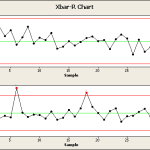
SPC Average and Range Charts

SPC Average and Range Charts

Introduction

In my prior article, the assumptions behind SPC were discussed in detail except for the analysis. There are two types data that may be analyzed, Counts and Measurement variables. This article focuses on normally distributed measurement variables, and the construction and usage of $-\bar{X}-$ and R charts.
[Read more…]

Filed Under: Articles, Big Data & Analytics, on Tools & Techniques Tagged With: Statistical Process Control (SPC)

by Fred Schenkelberg Leave a Comment

Chance of Catching a Shift in a Control Chart

Chance of Catching a Shift in a Control Chart

Control charts help us monitor and stabilize a process. A little graphics along with statistics provides a tool to identify when something has changed. Some changes are abrupt and obvious, other a little more subtle, yet the out of control signals each have approximately the same chance of alerting us to a change.

A little graphics along with statistics provides a tool to identify when something has changed. Some changes are abrupt and obvious, other a little more subtle, yet the out of control signals each have approximately the same chance of alerting us to a change. [Read more…]

Filed Under: Articles, CRE Preparation Notes, Probability and Statistics for Reliability Tagged With: Statistical Process Control (SPC)

by Fred Schenkelberg 1 Comment

Nelson Funnel Experiment

Nelson Funnel Experiment

Dr. Nelson created a simple experiment to illustrate the effect of meddling with a stable process. (Dr. Deming did something similar)

While the intent of making small changes to a process may be to make improvements, these perturbations generally increase the variation of the results.

To improve a process requires understanding the source of the variation and often controlled experiments to identify process improvements. [Read more…]

Filed Under: Articles, CRE Preparation Notes, Probability and Statistics for Reliability Tagged With: Statistical Process Control (SPC)

by Fred Schenkelberg 2 Comments

Individuals and Moving Range Charts

Individuals and Moving Range Charts

Another variation of the X-bar and R chart, in this case measuring and plotting individual readings instead of a sample average. The range value is obtained from the current reading and a fixed number of previous readings.

This type of control chart is suitable for calibration or testing situations where it is not practical to create subgroups of items for samples. [Read more…]

Filed Under: Articles, CRE Preparation Notes, Probability and Statistics for Reliability Tagged With: Statistical Process Control (SPC)

by Fred Schenkelberg Leave a Comment

X-bar and Sigma Charts

X-bar and Sigma Charts

The s chart replaces the R chart and provides an increase in sensitivity to variation of the spread of the data.

The s-chart works better with 10 or more items per sample in order to obtain the s (standard deviation) estimate. The use of a spreadsheet or calculator expedites the calculation of the sample standard deviation.

[Read more…]

Filed Under: Articles, CRE Preparation Notes, Probability and Statistics for Reliability Tagged With: Statistical Process Control (SPC)

by Fred Schenkelberg 2 Comments

Introduction to Control Charts

Introduction to Control Charts

Control charts provide an ongoing statistical test to determine if the recent set of readings represents convincing evidence that a process has changed or not from an established stable average.

The test also checks the sample to sample variation to determine if the variation is within the established stable range. A stable process is predictable and a control chart provides the evidence that a process is stable or not.

Some control charts use a sample of items for each measurement. The sample average values tend to be normally distributed allowing straightforward construction and interpretation of the control charts. The center line of a chart is the process average. The control limits are generally set at plus or minus three standard deviations (of the sample means – commonly called the sampling error of the mean) from the grand average.

[Read more…]

Filed Under: Articles, CRE Preparation Notes, Probability and Statistics for Reliability Tagged With: Statistical Process Control (SPC)

by Fred Schenkelberg Leave a Comment

Variable Selection for Control Charting

Variable Selection for Control Charting

Every process should operate stably. Every process may have many measurements available to monitor either various aspects to the final product or the assembly equipment. There may be hundreds of possible items to measure and monitor.

We do not have the resources nor time to apply control chart principles to each possible measurement. Control charts do not directly add value and they have a cost to maintain and interpret. While it may be tempting to add a dozen or so control charts, as the cost increases the value quickly decreases.

[Read more…]

Filed Under: Articles, CRE Preparation Notes, Probability and Statistics for Reliability Tagged With: Statistical Process Control (SPC)

by Fred Schenkelberg 3 Comments

Special and Common Causes of Process Variation

Special and Common Causes of Process Variation

As stated before, variation happens.

The root cause of the variation for a stable process includes material, environmental, equipment, and so on, changes that occur during the process. No saw cuts the same length of material twice – look close enough there is some difference. [Read more…]

Filed Under: Articles, CRE Preparation Notes, Probability and Statistics for Reliability Tagged With: Statistical Process Control (SPC)

by Fred Schenkelberg 4 Comments

Pre-Control Charts

Pre-Control Charts

An easy method to monitor and control a process average. It is an alternative to the Shewhart control chart.

Pre-control charts work well with stable and slow process drifts or changes. These charts provide a means to monitor a process and act as a guide for process centering.

They are easier to setup, implement, and interpret the Shewhart charts. [Read more…]

Filed Under: Articles, CRE Preparation Notes, Probability and Statistics for Reliability Tagged With: Statistical Process Control (SPC)

by Fred Schenkelberg Leave a Comment

When Are We Out of Control

When Are We Out of Control

For a stable process, nothing much happens. If the stable process is producing acceptable products, we should expect to continue to produce acceptable products.

Unless something changes. [Read more…]

Filed Under: Articles, CRE Preparation Notes, Probability and Statistics for Reliability Tagged With: Statistical Process Control (SPC)

by Fred Schenkelberg Leave a Comment

8 Steps to Creating an X-bar and s Control Chart

8 Steps to Creating an X-bar and s Control Chart

Once you decide to monitor a process and after you determine using an $- \bar{X} -$ & s chart is appropriate, you have to construct the charts.

The $- \bar{X} -$ & R charts use the range as an approximation of the variation in the population. When feasible use the standard deviation, s, rather than the range, R for the improved efficiency in detecting meaningful changes in process variation. [Read more…]

Filed Under: Articles, CRE Preparation Notes, Probability and Statistics for Reliability Tagged With: Statistical Process Control (SPC)

  • 1
  • 2
  • Next Page »

[popup type="" link_text="Get Weekly Email Updates" link_class="button" ][display_form id=266][/popup]

The Accendo Reliablity logo of a sun face in circuit

Please login to have full access.


Lost Password? Click here to have it emailed to you.

Not already a member? It's free and takes only a moment to create an account with your email only.

Join

Your membership brings you all these free resources:

  • Live, monthly reliability webinars & recordings
  • eBooks: Finding Value and Reliability Maturity
  • How To articles & insights
  • Podcasts & additional information within podcast show notes
  • Podcast suggestion box to send us a question or topic for a future episode
  • Course (some with a fee)
  • Largest reliability events calendar
  • Course on a range of topics - coming soon
  • Master reliability classes - coming soon
  • Basic tutorial articles - coming soon
  • With more in the works just for members
Speaking of Reliability podcast logo

Subscribe and enjoy every episode

RSS
iTunes
Stitcher

Join Accendo

Receive information and updates about podcasts and many other resources offered by Accendo Reliability by becoming a member.

It’s free and only takes a minute.

Join Today

Dare to Know podcast logo

Subscribe and enjoy every episode

RSS
iTunes
Stitcher

Join Accendo

Receive information and updates about podcasts and many other resources offered by Accendo Reliability by becoming a member.

It’s free and only takes a minute.

Join Today

Accendo Reliability Webinar Series podcast logo

Subscribe and enjoy every episode

RSS
iTunes
Stitcher

Join Accendo

Receive information and updates about podcasts and many other resources offered by Accendo Reliability by becoming a member.

It’s free and only takes a minute.

Join Today

Recent Articles

  • Gremlins today
  • The Power of Vision in Leadership and Organizational Success
  • 3 Types of MTBF Stories
  • ALT: An in Depth Description
  • Project Email Economics

© 2025 FMS Reliability · Privacy Policy · Terms of Service · Cookies Policy