Accendo Reliability

Your Reliability Engineering Professional Development Site

  • Home
  • About
    • Contributors
    • About Us
    • Colophon
    • Survey
  • Reliability.fm
  • Articles
    • CRE Preparation Notes
    • NoMTBF
    • on Leadership & Career
      • Advanced Engineering Culture
      • ASQR&R
      • Engineering Leadership
      • Managing in the 2000s
      • Product Development and Process Improvement
    • on Maintenance Reliability
      • Aasan Asset Management
      • AI & Predictive Maintenance
      • Asset Management in the Mining Industry
      • CMMS and Maintenance Management
      • CMMS and Reliability
      • Conscious Asset
      • EAM & CMMS
      • Everyday RCM
      • History of Maintenance Management
      • Life Cycle Asset Management
      • Maintenance and Reliability
      • Maintenance Management
      • Plant Maintenance
      • Process Plant Reliability Engineering
      • RCM Blitz®
      • ReliabilityXperience
      • Rob’s Reliability Project
      • The Intelligent Transformer Blog
      • The People Side of Maintenance
      • The Reliability Mindset
    • on Product Reliability
      • Accelerated Reliability
      • Achieving the Benefits of Reliability
      • Apex Ridge
      • Field Reliability Data Analysis
      • Metals Engineering and Product Reliability
      • Musings on Reliability and Maintenance Topics
      • Product Validation
      • Reliability by Design
      • Reliability Competence
      • Reliability Engineering Insights
      • Reliability in Emerging Technology
      • Reliability Knowledge
    • on Risk & Safety
      • CERM® Risk Insights
      • Equipment Risk and Reliability in Downhole Applications
      • Operational Risk Process Safety
    • on Systems Thinking
      • Communicating with FINESSE
      • The RCA
    • on Tools & Techniques
      • Big Data & Analytics
      • Experimental Design for NPD
      • Innovative Thinking in Reliability and Durability
      • Inside and Beyond HALT
      • Inside FMEA
      • Institute of Quality & Reliability
      • Integral Concepts
      • Learning from Failures
      • Progress in Field Reliability?
      • R for Engineering
      • Reliability Engineering Using Python
      • Reliability Reflections
      • Statistical Methods for Failure-Time Data
      • Testing 1 2 3
      • The Manufacturing Academy
  • eBooks
  • Resources
    • Accendo Authors
    • FMEA Resources
    • Glossary
    • Feed Forward Publications
    • Openings
    • Books
    • Webinar Sources
    • Podcasts
  • Courses
    • Your Courses
    • Live Courses
      • Introduction to Reliability Engineering & Accelerated Testings Course Landing Page
      • Advanced Accelerated Testing Course Landing Page
    • Integral Concepts Courses
      • Reliability Analysis Methods Course Landing Page
      • Applied Reliability Analysis Course Landing Page
      • Statistics, Hypothesis Testing, & Regression Modeling Course Landing Page
      • Measurement System Assessment Course Landing Page
      • SPC & Process Capability Course Landing Page
      • Design of Experiments Course Landing Page
    • The Manufacturing Academy Courses
      • An Introduction to Reliability Engineering
      • Reliability Engineering Statistics
      • An Introduction to Quality Engineering
      • Quality Engineering Statistics
      • FMEA in Practice
      • Process Capability Analysis course
      • Root Cause Analysis and the 8D Corrective Action Process course
      • Return on Investment online course
    • Industrial Metallurgist Courses
    • FMEA courses Powered by The Luminous Group
    • Foundations of RCM online course
    • Reliability Engineering for Heavy Industry
    • How to be an Online Student
    • Quondam Courses
  • Calendar
    • Call for Papers Listing
    • Upcoming Webinars
    • Webinar Calendar
  • Login
    • Member Home
  • Barringer Process Reliability Introduction Course Landing Page
  • Upcoming Live Events
You are here: Home / Articles / The Stress-Strength Concept in Practice

by Fred Schenkelberg 3 Comments

The Stress-Strength Concept in Practice

The Stress-Strength Concept in Practice

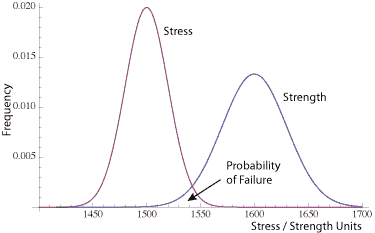
Ideally, in every design of every component, the stress–strength relationship looks like this figure. The stress is well below the strength.

Stress-Strength-apart

This implies there is very little chance of failure due to the element being overstressed.

Also, ideally, we fully characterize all stresses and all strengths for each element of a product. This is generally difficult to accomplish and it is rarely done to that extent.

Stress-Strength

In practice, we narrow down the list of critical parts and then perform the stress — strength calculations.

There are occasions where there is a definite possibility that some of the elements will experience the chance of stresses that are higher than that element’s ability to survive. It is this intersection between the two curves that provides the probability of failure.

To calculate that area is to define the double integral that solves for the probability of the stress being higher than the strength. Think of a small normal curve under the overlapping curves.

NOTE: I did not shade in the area under both curves which would overstate the probability of failure. As noted by careful readers, in the case when both stress and strength are normally distributed (be sure to verify that is true) the probability of failure is itself a normal curve. I was not able to draw a good enough looking small normal curve and will try to sort it out so it’s clear.

Application

In practice the stress curve and the strength curves are unknown. In many cases with a little work, we can gather sufficient data to plot two histograms and visually check for the margin.

A little more work using statistical tools allows an estimate of the probability the strength is applied to an item with low strength.

We typically use tools like engineering judgment, Design FMEA, HALT and prototype failures to isolate which elements may require detailed stress/strength analysis.

The concept applies when making design decisions even without sufficient data to plot the two curves.

Design or derating guidelines and best practices allow the team to create sufficient design margin with the initial design.

Over Time

Things change. Material degrades, creeps, or become brittle. Metals rust, contacts corrode, PN junctions blur boundaries, and more. Overtime the product that started working perfectly eventually fails.

The strength curve may simply shift towards the stress curve. Or it may widen the spread of the curve. Either way, it increases the probability given the same stress curve that a failure will occur.

And the stress curve is not static. Customers continue to find harsher and more demanding environments to use a product.

Summary

When I was first introduced to this concept, it just made sense. And I suspect, it does to any engineer.

The idea that we can create components with exactly known capabilities and fully characterize the applied stress thought the product lifetime is folly.

One approach is creating products with plenty of margin (distance between the stress and strength curves). In critical applications or when working to reduce the chance of failures, we gather the data and plot the curves. Even do the calculations of probability of failure.

A little engineering statistics is good fun.


Related:

Stress Strength Normal Assumption (article)

Introduction to Control Charts (article)

Reliability Block Diagrams Overview and Value (article)


Filed Under: Articles, Musings on Reliability and Maintenance Topics, on Product Reliability Tagged With: Stress-strength analysis

About Fred Schenkelberg

I am the reliability expert at FMS Reliability, a reliability engineering and management consulting firm I founded in 2004. I left Hewlett Packard (HP)’s Reliability Team, where I helped create a culture of reliability across the corporation, to assist other organizations.

« Does HALT Lead to Product Over-Design?
The 2015 Recommended References Survey »

Comments

  1. Steve Wachs says

    November 19, 2015 at 6:50 PM

    Hi Fred,
    The intersecting area does not equal the probability of failure – as you seem to indicate by your comment about not shading in the area. It’s really a joint probability so not easily visualized as any area on these two curves. It IS the area to the left of zero on the normal curve for the random variable Strength-Stress (which IS a normal distribution if both Strength and Stress are normal). I assume you are just trying to keep things basic here – but thought I’d clarify anyway.
    Thanks for all the great work you do!

    Reply
    • Fred Schenkelberg says

      November 19, 2015 at 7:34 PM

      Hi Steve,

      Basic intro – need to follow up with a better article on the math involved someday. Maybe you could write it?

      Thanks for the comment and amplification.

      Cheers,

      Fred

      Reply
  2. Hilaire Perera says

    July 5, 2019 at 10:23 AM

    For Mechanical Components, reliability can be predicted using the Stress/Strength Interference and Probabilistic Design method. This method assumes that the material properties are time independent because of their slow change, and the components are not subjected to wear related failure modes.

    When components are subjected to reversing mechanical loads that exhibit a single failure mode, the reliability is designed in by selecting the probability number representing the Safety Margin. For the use of this methodology, Binary (Mean & Standard Deviation) Synthesis of the classical equations are needed

    https://www.slideshare.net/HPERERA/reliability-prediction-procedure-for-mechanical-components

    Reply

Leave a Reply Cancel reply

Your email address will not be published. Required fields are marked *

Article by Fred Schenkelberg
in the Musings series

Join Accendo

Receive information and updates about articles and many other resources offered by Accendo Reliability by becoming a member.

It’s free and only takes a minute.

Join Today

Recent Articles

  • Gremlins today
  • The Power of Vision in Leadership and Organizational Success
  • 3 Types of MTBF Stories
  • ALT: An in Depth Description
  • Project Email Economics

© 2025 FMS Reliability · Privacy Policy · Terms of Service · Cookies Policy