
The (age-specific or actuarial) force of mortality drives the demand for spares, service parts, and most products. The actuarial demand forecast is Σd(t‑s)*n(s), where d(t-s) is (age-specific) actuarial demand rate and n(s) is the installed base of age s, s=0,1,2,…,t. Ulpian, 220 AD, made actuarial forecasts of pension costs for Roman Legionnaires. (Imagine computing actuarial demand forecasts with Roman numerals.) Actuarial demand rates are functions of reliability. What if reliability changes? We Need Statistical Reliability Control (SRC).
Actuarial demand forecasts require updating as installed base and field reliability data accumulates. Actuarial failure rate function, a(t), is related to reliability function, R(t), by a(t) = (R(t)-R(t-1))/R(t-1), t=1,2,… If products or parts are renewable or repairable, then actuarial demand rate function, d(t), depends on the number of prior renewals or repairs by age t [George, Sept. 2021].
Actuarial demand forecasts are credible because actuarial rates are based on field data. Grouped failure inputs make actuarial rates (derived from the Kaplan (KM) estimator) credible because KM estimator is a maximum likelihood reliability estimator. Nonparametric actuarial rate estimators from ships and returns counts are credible, because they are derived from data required by Generally Accepted Accounting Principles, and because the estimates are either maximum likelihood or least squares population estimators [George, 1993 and April 2021]. … credible as long as the actuarial rates don’t change too much.
A Modest Proposal
Statistical process control (SPC) or statistical quality control (SQC) should be applied to reliability function estimates (Weibull from lifetime data, KM estimator from grouped cohort failure counts, or nonparametric estimators from population ships and returns counts). Statistical Reliability Control (SRC) naturally follows SPC and SQC but SPC and SQC apply to proportions failing to meet specifications, not to reliability functions.
Imagine Statistical Reliability Control (SRC) on successive reliability function estimates such as broom charts. Broom charts are graphs of successive reliability estimates as cohorts of ships add to the population. Broom charts could come from each cohort of Kaplan-Meier (KM) grouped failure counts or from nonparametric reliability estimates from successively larger data sets as ships and returns accumulate.
Kullback-Leibler (KL) divergence is the relative entropy difference between two successive reliability function estimates [Wikipedia]. KL divergence converts differences in functions into a single numbers for SRC.
Imagine the KL divergence jumps from one period or subset to the next? What happened? There’s information in that jump; where did the jump come from? There are other divergence measures. I prefer KL divergence, because it may be related to the reliability change. Imagine if the product was software; the KL divergence may be related to code changes. I would also compare the KL divergence to the entropies in successive reliability estimates before and after suspicious KL divergence. What else could be done? Look at high-entropy reliability or failure rate functions for infant mortality, warranty returns or PM glitches, premature wearout, seasonality, and retirement.
Time Series Analysis (TSA) demand forecasting extrapolates past demand data such as for commodities. TSA searches for the times series model that wins a “tournament”, a contest between different models. The winner depends on the training data or subset of the data. TSA forecasting doesn’t account for changes in installed base, attrition, or force of mortality, even though it models past demand data.
Actuarial forecasts have no such ambiguity. Actuarial forecasts use all information in available data: life data, grouped lifetimes, or ships and returns counts. Walter Shewhart Rule number one says, “Original data should be presented in a way that will preserve the evidence in the original data for all the predictions assumed to be useful.” Nonparametric estimates preserve all information in data. Maximum likelihood estimates yield the most likely actuarial failure rate function estimates. Least squares yields the estimates that minimize the squared difference between observed and expected returns. Gauss Markov theorem says least squares yields the least sample variance among linear unbiased estimators. (An actuarial forecast is a linear function of installed base n(s).)
Actuarial demand forecasting works with other business processes. Accurate spares sales and service forecasts are fundamental inputs to a manufacturing company’s production planning, inventory, and production maintenance processes. Designers, process engineers, trainers, customers, and service people welcome feedback from reliability and failure rate function estimates and forecasts. Warranty reserves are functions of failure or returns forecasts times costs of returns. Recalls, warranty, and end-of-life plans depend on reliability forecasts. Corporate valuations depend on forecasts of the future streams of sales revenue and warranty, service, recall, and end-of-life costs.
Eyeball SRC on EEPROM Reliability Functions?
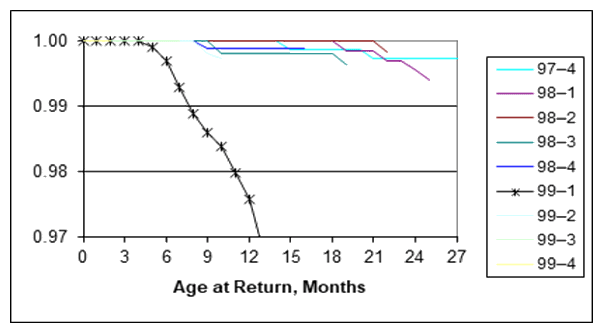
Figure 1 is computed from each cohort of grouped ships and failure counts, inputs to the Kaplan-Meier reliability estimator. Power generation and distribution controls’ EEPROMS were losing their little memories! Obviously something went wrong in 1999-1. In late 1999, we asked the vendor, Catalyst Semiconductor, and they admitted they shrunk the die size and claimed to have fixed it. Claim seems true for subsequent quarters. That’s because the figure 1 reliability functions are shorter than 99-1 and have higher reliabilities than 99-1. That’s clearly evident in the K-L divergence in figure 2.

The KL divergence quantifies the differences between pairs of subsequent cohorts’ reliability functions. The units of divergences are relative entropies in bits. Wikipedia calls that “expected excess surprise,” from one quarter to the next. [See also https://en.wikipedia.org/wiki/Variation_of_information.] Consider comparing the KL divergence with the entropies in each reliability function of pairs of successive reliability function estimates [George, Sept. 2021].
Table 1. Entropy, KL Divergence, and the ratio KL Div/Entropy for EEPROMs by calendar quarter cohorts. Logarithms are to the base 2, so entropy is in bits.
| Quarter | Entropy | KL Div | Ratio |
| 97–1 | 33.92 | 0 | 0 |
| 97–2 | 17.98 | 0 | 0 |
| 97–3 | 8.69 | 0 | 0 |
| 97–4 | 19.05 | 0 | 0 |
| 98–1 | 37.55 | -3E-04 | 0.00% |
| 98–2 | 9.16 | 0 | 0 |
| 98–3 | 18.16 | 0 | 0 |
| 98–4 | 9.76 | -0.002 | 0.02% |
| 99–1 | 75.05 | 0.0045 | 0.01% |
| 99–2 | 19.23 | 0 | 0 |
| 99–3 | 0.00 | 0 | 0 |
| 99–4 | 0.00 | 0 | 0 |
Clearly from figure 1 and from the 99-1 entropy of 75.05 bits, the 99-1 cohort was different. However the ratio of Kl divergence to 99-1 entropy, 0.01%, was not as large as that from 98-4, 0.02%. That’s what makes me wonder if the EEPROM problem started in 98-4.
EEPROM problems might have started in 1998-4 although not serious, because reliability was high and entropy in 98-4 was below average. However 99-1 shows large entropy because reliability deteriorated and startling difference even from 98-4 shown by KL divergence between 98-4 and 99-1. Reliability of subsequent quarterly cohorts returned to normal.
Do we need SRC on reliability function entropies to update actuarial demand rates for actuarial forecasts? Actuarial forecasts and their distributions depend on the entropy (information) in the reliability function. I haven’t figured out how entropy affects actuarial forecasts, the rate of change per unit of entropy δSUM[a(t‑s)*n(s)]/δentropy and their distributions, but I will try.
Do we need SRC on KL divergence? KL divergence quantifies the expected surprise from one period to the next. How much divergence calls for action? Look at past actions and compare them with past KL divergences. I will use the methods from SPC to construct control limits and rules similar to SPC and SQC.
The figure 1 EEPROM broom chart clearly showed a problem. What if problem(s) were more subtle or different?
- Do SRC on many products or parts?
- Suppose some parts’ reliabilities are statistically dependent?
- Data are samples of lifetimes. How large samples are needed ?
- Compare samples of grouped failure counts by cohorts (KM reliability estimate) vs. individual sample lifetimes estimates? Lifetime data costs more than grouped failure counts.
- Compare population periodic ships (cohorts) and returns counts instead of grouped failure counts by cohorts? Grouped failure counts by cohort (KM) cost more than ships and returns from data required by GAAP.
- Link entropy bits or KL divergence bits to design, process, or program changes, especially software.
Want SRC on your data? Send periodic cohort field reliability data to pstlarry@yahoo.com.
References by George
Please see Wikipedia for entropy and Kullback-Leibler divergence.
“Estimate Reliability Functions Without Life Data,” Reliability Review, ASQC, Vol. 13, No. 1, pp 21-26, March 1993
“Want Field Reliability Without Life Data?” Weekly Update, /want-field-reliability-without-life-data/, April 2021
“Renewal Process Estimation, Without Life Data, Weekly Update, https://fred-schenkelberg-project.prev01.rmkr.net/renewal-process-estimation-without-life-data/, Sept. 2021
“How can you Estimate Reliability Without Life Data?” Weekly Update, https://fred-schenkelberg-project.prev01.rmkr.net/can-estimate-reliability-without-life-data/, May 2022

Leave a Reply