Stability studies are used to understand and model the degradation of key product characteristics over time. They are often used to determine the product’s shelf life (the length of time a product may be stored without becoming unfit for use or consumption).
Shelf-Life studies should identify the potential “failure modes” and how they will assessed/ measured. Examples of characteristics that are measured often include appearance attributes, texture, taste, microbial counts, and product effectiveness/performance.
In this article, we look at shelf-life determination when we are focused on a primary failure mode that will likely occur first. In a future article, we will look at alternative methods that enable the shelf-life determination to account for multiple possible failure modes (competing risks).
Defining Fitness for Use
To be fit for use, a product should meet defined specification limits or satisfy other criteria for an acceptable product. The assessment may be objective (measureable with capable measurement system) or subjective (subject to differences of opinion). Shelf life is often based on a specified proportion of the product considered to be unfit (e.g. When 5% of the product is expected to be non-conforming). Note that 0% is not an option since we are dealing with continuous probability distributions. This selected proportion depends on the risks involved.
It is not recommended to determine shelf-life based on observing a statistical difference from baseline. Statistical differences may not be practically significant, and the determination of a statistical difference is a function of sample size. The shelf-life should reflect practical differences in the product performance that make it unfit for use.
Also, because all estimates have uncertainty, we typically assign a specified confidence level (e.g. 95%, 99%) to a shelf-life estimate. This is typically a one-sided bound so that we can say that the shelf life is at leastsome lower bound estimate (on the time scale) with a specified confidence.
Stability Study under Normal Conditions with Regression Models to Predict Shelf Life
Here we monitor and measure degradation over time (but not necessarily to failure) and use a mathematical model to predict shelf life (via extrapolation in time). Note that the extrapolation adds uncertainty to the shelf-life prediction.
Stability studies assess and model the degradation of product characteristics over time. Units/Samples are measured over time (quantitative measurements). A statistical model (regression) can be fit to the data and extrapolation may be performed to estimate the shelf life (based on a defined specification limit and shelf-life criteria). The specification limit refers to the minimum or maximum acceptable value.
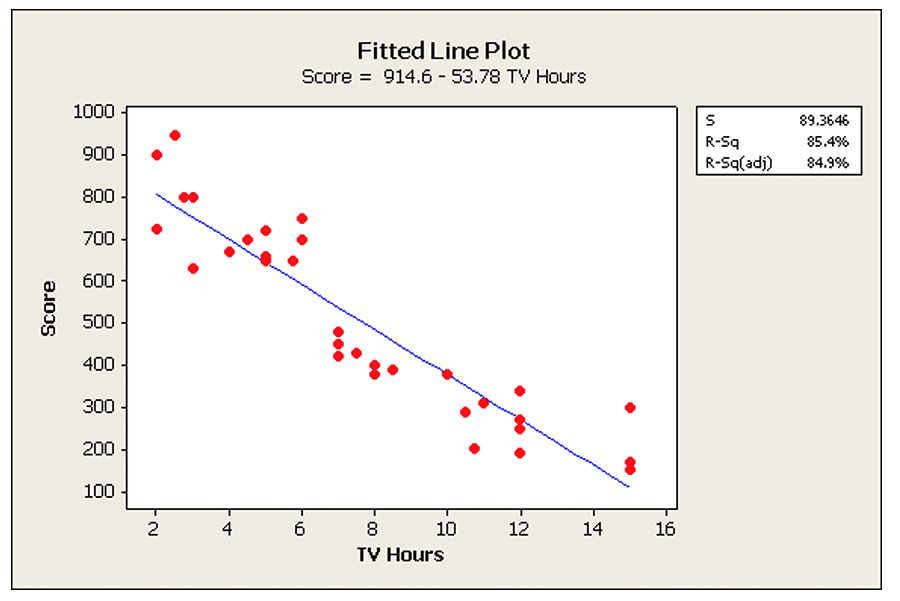
Standard Regression models predict how the mean of a normally distributed characteristic changes as a function of one or more predictors. For example, the simple linear regression model below predicts how the average score on a standardized test decreases as the hours of TV watching per week increases
Example: Predicting Shelf Life from Stability Data
Now let’s consider using stability data to predict shelf life. We assume that insufficient time exists to test/age the product until failure. Regression models will be utilized to predict the shelf life (by extrapolating).
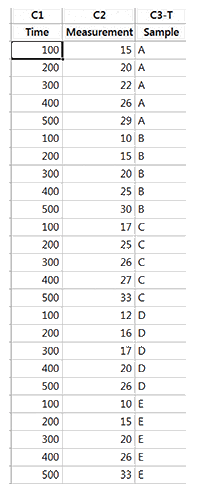
5 Samples of a chemical (that degrades over time) are measured over time. As degradation occurs, the measured values get larger. If the measured value exceeds 50, the product is considered to be unfit for use (Thus 50 is the upper specification limit). The data is shown below.
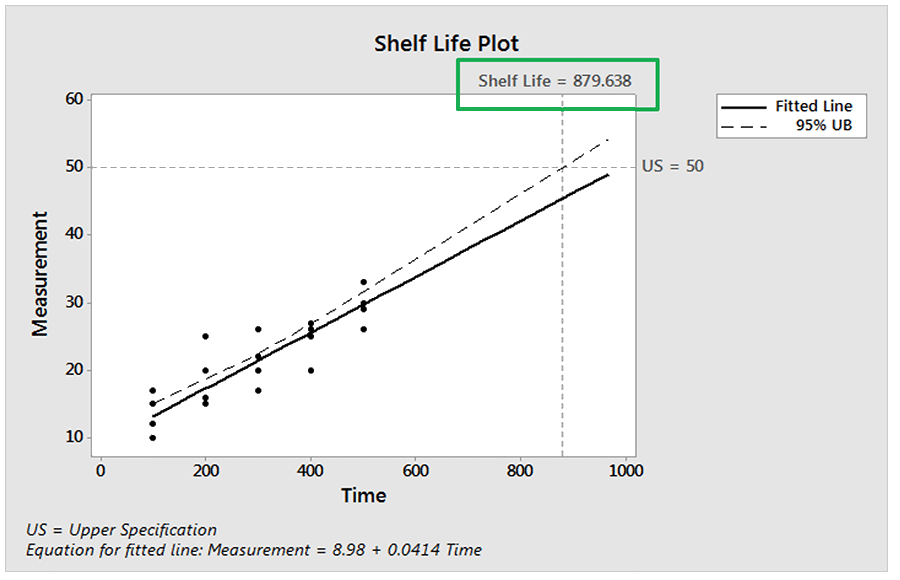
Next, we fit a regression line (for the mean) to the measurement data vs. time. We have also included the upper 95% confidence bound for the regression line. Based on this model, we are 95% confident that half of the products will still be fit for use at a time of 880. This is shown on the Shelf-Life Plot below. Note that the Simple Linear regression procedure assumes that data at each time point are normally distributed so the mean and median (50th percentile) are the same value.
Typically, we would base a shelf-life estimate using a percentile other than 50% so that only a relatively small proportion would be non-conforming at the shelf-life time. Below is a regression model showing the 90thpercentile regression line along with its 95% upper confidence bound.
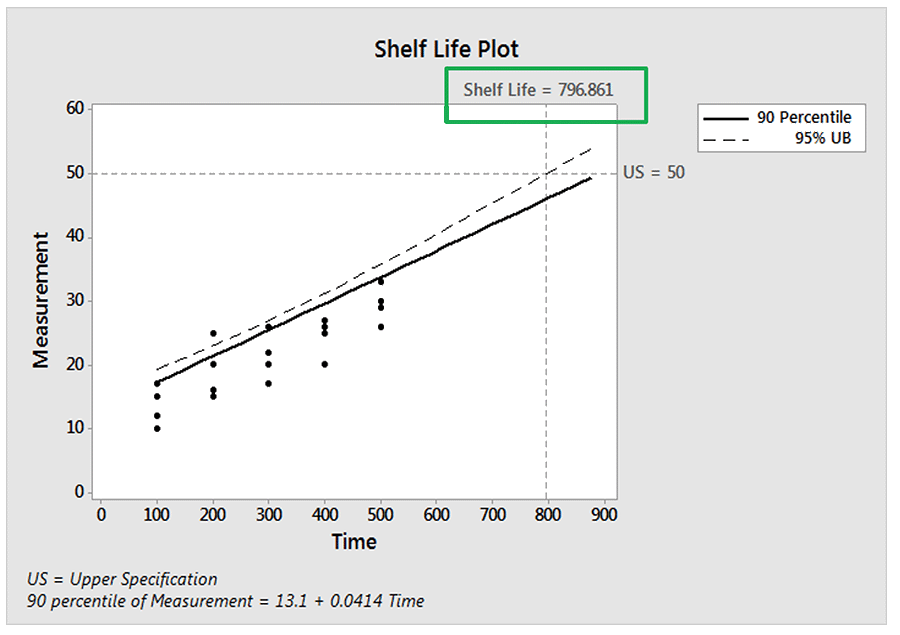
So, the time (shelf-life) at which we are 95% confident that at least 90% of the responses are below the upper specification limit of 50 is 797. If we want to ensure more than 90% are conforming, then we will have an even lower shelf-life time.
Model Diagnostics
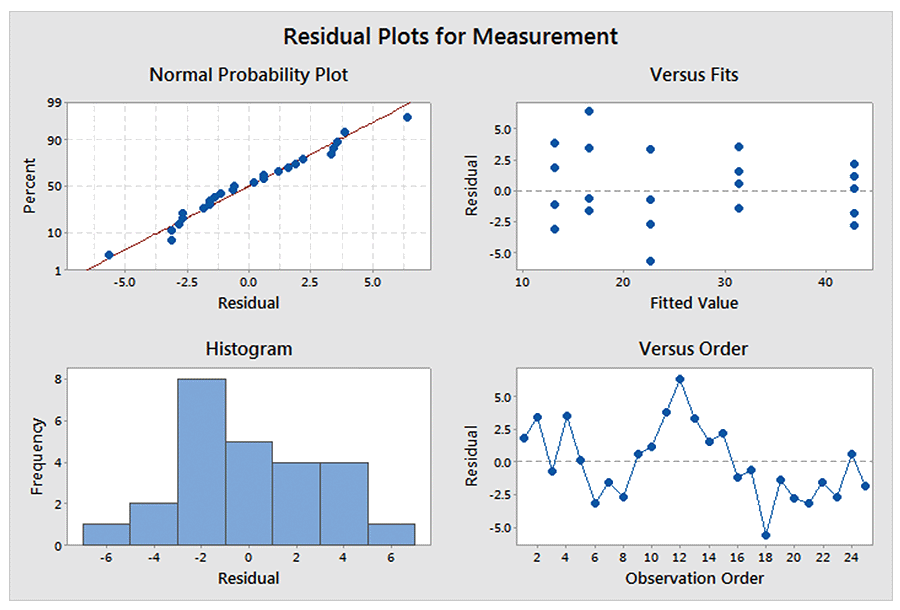
The standard regression procedure has several assumptions. The key ones are:
- The response values at each level of the predictor follow a normal distribution
- The variance of the responses is constant across the range of predictor values
- The response values are independent of each other
These assumptions are normally verified graphically using residual plots (an example is shown below).
Other Situations
The above simple example was straight-forward since the simple linear regression model adequately described the data. More complex situations arise in practice such as:
- Non-linear relationships between the response values and time. The degradation may accelerate or decelerate over time leading to the need for a non-linear model to adequately describe the data.
- Multiple degradation/failure modes that exist, any of which could cause the product to become unfit for use. In this case, more traditional reliability methods may be used to estimate the shelf life after first estimating the system reliability (or failure probability) after accounting for all possible failure modes.
- Accounting for the impact of lot-to-lot or batch-to-batch variation on the shelf life. This is common in the pharmaceutical industry. Ideally data from different lots may be combined to produce a single shelf life estimate from all the data but only if the batches are shown to be homogeneous. If the batches are non-homogeneous, we base the shelf-life estimate on the worst-case batch.
- When accelerated test conditions are necessary to observe failures or degradation leading to failure. In this case, an accelerated life test model must also be developed to relate failure times at accelerated conditions to expected failure times at normal use conditions
These more complex situations are covered in detail in our training courses.
Issues and Guidelines for Shelf-Life Estimation
Finally, we provide some guidelines for shelf-life estimation.
- Shelf-Life estimates based on model extrapolations (over time and/or stress levels) should be validated with longer term testing. Extrapolation presents a risk that the fitted model may not hold throughout the extrapolation range. The greater the extrapolation the greater the uncertainty in the estimates.
- Sensitivity Analysis (impact of varying the fitted model) should be performed. This gives us an idea of how much our resulting estimates change if we specify other plausible models.
- Product specimens should be chosen to reflect the maximum potential production variability (e.g. multiple lots, batches, production conditions, etc.)
- Sample Sizes needed to produce useful information depend on the method(s) utilized, eventual models specified, etc. Analytical methods are available to support sample size determination.
- Sampling frequency and times will depend on the method utilized (e.g. testing until failure observed vs. predicting failure times via model extrapolation)
Summary
This article focused on the use of regression modeling to estimate a product’s shelf-life. The process involves first defining fitness for use for the product and the parameters for the shelf life statement (proportion meeting specification and confidence level). The emphasis was on the basic procedure when Simple Linear Regression with a linear model adequately describes the data and when the stability measurements are made under normal use/storage conditions. We also assumed only a single degradation characteristic determines the shelf-life.

Leave a Reply