Accendo Reliability

Your Reliability Engineering Professional Development Site

  • Home
  • About
    • Contributors
    • About Us
    • Colophon
    • Survey
  • Reliability.fm
  • Articles
    • CRE Preparation Notes
    • NoMTBF
    • on Leadership & Career
      • Advanced Engineering Culture
      • ASQR&R
      • Engineering Leadership
      • Managing in the 2000s
      • Product Development and Process Improvement
    • on Maintenance Reliability
      • Aasan Asset Management
      • AI & Predictive Maintenance
      • Asset Management in the Mining Industry
      • CMMS and Maintenance Management
      • CMMS and Reliability
      • Conscious Asset
      • EAM & CMMS
      • Everyday RCM
      • History of Maintenance Management
      • Life Cycle Asset Management
      • Maintenance and Reliability
      • Maintenance Management
      • Plant Maintenance
      • Process Plant Reliability Engineering
      • RCM Blitz®
      • ReliabilityXperience
      • Rob’s Reliability Project
      • The Intelligent Transformer Blog
      • The People Side of Maintenance
      • The Reliability Mindset
    • on Product Reliability
      • Accelerated Reliability
      • Achieving the Benefits of Reliability
      • Apex Ridge
      • Field Reliability Data Analysis
      • Metals Engineering and Product Reliability
      • Musings on Reliability and Maintenance Topics
      • Product Validation
      • Reliability by Design
      • Reliability Competence
      • Reliability Engineering Insights
      • Reliability in Emerging Technology
      • Reliability Knowledge
    • on Risk & Safety
      • CERM® Risk Insights
      • Equipment Risk and Reliability in Downhole Applications
      • Operational Risk Process Safety
    • on Systems Thinking
      • Communicating with FINESSE
      • The RCA
    • on Tools & Techniques
      • Big Data & Analytics
      • Experimental Design for NPD
      • Innovative Thinking in Reliability and Durability
      • Inside and Beyond HALT
      • Inside FMEA
      • Institute of Quality & Reliability
      • Integral Concepts
      • Learning from Failures
      • Progress in Field Reliability?
      • R for Engineering
      • Reliability Engineering Using Python
      • Reliability Reflections
      • Statistical Methods for Failure-Time Data
      • Testing 1 2 3
      • The Manufacturing Academy
  • eBooks
  • Resources
    • Accendo Authors
    • FMEA Resources
    • Glossary
    • Feed Forward Publications
    • Openings
    • Books
    • Webinar Sources
    • Podcasts
  • Courses
    • Your Courses
    • Live Courses
      • Introduction to Reliability Engineering & Accelerated Testings Course Landing Page
      • Advanced Accelerated Testing Course Landing Page
    • Integral Concepts Courses
      • Reliability Analysis Methods Course Landing Page
      • Applied Reliability Analysis Course Landing Page
      • Statistics, Hypothesis Testing, & Regression Modeling Course Landing Page
      • Measurement System Assessment Course Landing Page
      • SPC & Process Capability Course Landing Page
      • Design of Experiments Course Landing Page
    • The Manufacturing Academy Courses
      • An Introduction to Reliability Engineering
      • Reliability Engineering Statistics
      • An Introduction to Quality Engineering
      • Quality Engineering Statistics
      • FMEA in Practice
      • Process Capability Analysis course
      • Root Cause Analysis and the 8D Corrective Action Process course
      • Return on Investment online course
    • Industrial Metallurgist Courses
    • FMEA courses Powered by The Luminous Group
    • Foundations of RCM online course
    • Reliability Engineering for Heavy Industry
    • How to be an Online Student
    • Quondam Courses
  • Calendar
    • Call for Papers Listing
    • Upcoming Webinars
    • Webinar Calendar
  • Login
    • Member Home
  • Barringer Process Reliability Introduction Course Landing Page
  • Upcoming Live Events
You are here: Home / Articles / Graphical Representations in Reliability Analytics

by André-Michel Ferrari Leave a Comment

Graphical Representations in Reliability Analytics

Graphical Representations in Reliability Analytics

Introduction

Reliability Engineering analytics come with graphs and visual representations providing the analyst with various types of key information. Some graphs are more popular than others. This article highlights the 4 main graphs used in Reliability Engineering Analysis.

They are Reliability, Probability of Failure, Probability Density and Failure Rate. Less common types are not covered here. Such as Contour Plots. The basis of the graphs in this article is the Weibull Distribution. In other words, all the graphs derive from this very popular distribution. The same concepts applies to other distributions.

Reliability Academic Definition

The concept of Reliability is often misused, misunderstood, and misinterpreted. Reliability in its academic root, is defined as the probability that a system will perform its intended function in a specified mission time and within specific process conditions. So, it is in essence a Probability.

The time variable is crucial in understanding the reliability of a system. Reliability is the Probability of Success. And 1 minus the Probability of Failure.

$$ \displaystyle \large R\left(t\right) = 1 – F\left(t\right) \:\:\:\: (where \: F = Failure \: Probability) (1) $$

Let us apply this concept to that of a Roller Bearing. The life analysis of a Roller Bearing population is modelled by a Weibull Distribution. A question that could be asked is (2):

  • What is the Reliability of a newly installed bearing for a year, provided it is operating within ideal specification parameters?
  • Or… what is the probability that the bearing will last a year without an unplanned failure within those same conditions?

Reliability Functions and Graphs

Using Equation (1) above, we have two functions (R(t) and F(t)). Hence, we will have two graphs for the bearing as shown below.

Graph 1 – Reliability and Probability of Failure Functions for a Roller Bearing (Life Distribution: 2 Parameter Weibull, Eta = 53,404 hours, Beta = 1.32)

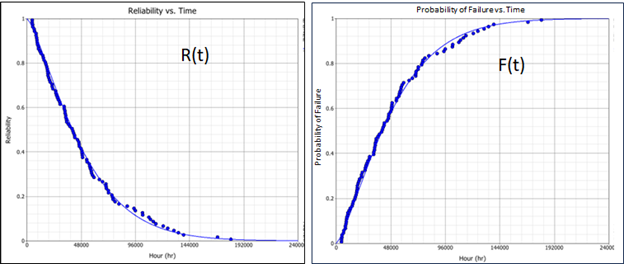
By nature of the mathematical equations (1), the two graphs are mirror images. Question 2 above can be graphically answered such as: R(t=8,760 hours) = 91%. In other words, the bearing has a 9 % chance of failure after one year of operation.

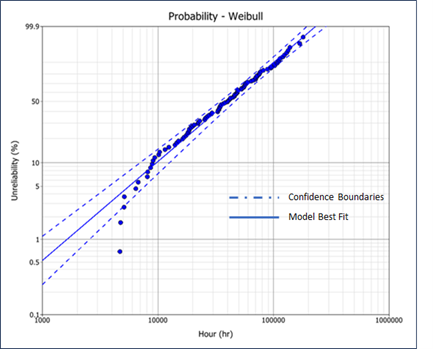
F(t) has multiple names. It is known as the Cumulative Density Function or the Unreliability Function.  And is a mathematical integration of the Probability Density Function covered below. The Weibull distribution has unique and highly useful particularities. Its derived Probability of Failure function can be turned into a straight line through logarithmic transformation. Graph 2 below illustrates this transformation. There are a lots of visual advantages to this graph including changes in inflection (e.g. Doglegs) as well as the ability to evaluate the model validity using Confidence Boundaries.

Graph 2 – Bearing Probability of Failure plot on Logarithmic paper with 90% Confidence Boundaries (Life Distribution: 2 Parameter Weibull, Eta = 53,404, hours Beta = 1.32)

Probability Density Functions (PDF) and Graphs

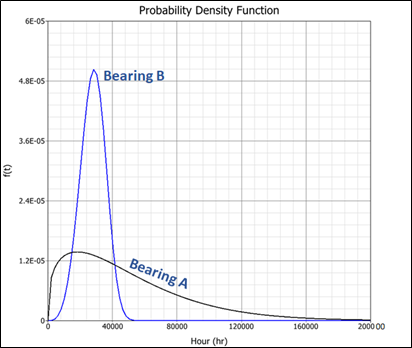
The Probability Density function is a normalized Frequency Graph. The integrated area under the graph is equal to 1. The PDF graph provides the analyst with an overview of the data layout. Especially relating to the scatter or variability of data. Graph 3 below shows PDF curves for two Roller Bearing types. Bearing A has a larger variability in terms of its time to failure. This suggests that Bearing B will have a more precise range of time to failure around the peak (mode) of 30,000 hours of operation.

Graph 3 – Probability Density Function plots for two Roller Bearing Types (Life Distributions: Bearing A: 2 Parameter Weibull, Eta = 53,404 hours Beta = 1.32, Bearing B: 2 Parameter Weibull, Eta = 30,649 hours Beta = 4.05)

Failure Rate Functions (PDF) and Graphs

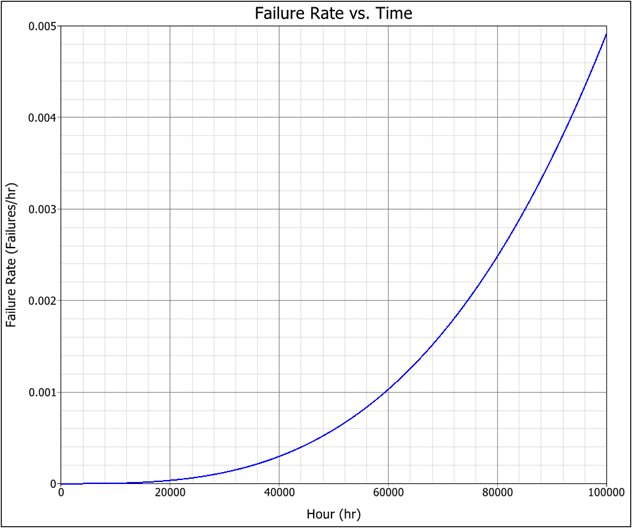
The Failure Rate function highlights the “speed” of failure over time. Typically, though not always, age will cause accelerated degradation in components or assets. For example, an ageing automobile in continuous use, will see more frequents failures over time until it is no longer economically viable to keep it. Its Failure Rate will increase over time.

The patterns associated with the Failure Rate curve indicate the Failure nature. In the case of our initial bearing B above, because its Beta Parameter is more than 1, it will show an increase in Failure Rate over time (Graph 4). Signaling wear out and imminent loss of function.

Graph 4 – Failure Rate Curve for a Roller Bearing – (Life Distribution: Weibull 2 Parameter Eta = 30,649 hours Beta = 4.05)

One of the best-known concepts and subsequent graphical representation relating to Failure Rate is the Bathtub curve. It is a combination of 3 Failures Rate curves with 3 Beta values as follows.

  • Beta less than 1, representing infant mortality or early failures,
  • Beta equal to 1 representing random failures,
  • Beta more than 1, representing ageing or wear out failures.

Graph 5 below illustrates a theoretical example of a Bathtub curve.

Graph 5 – Theoretical Bathtub Curve

In summary, graphical representations in Reliability Engineering are precise and can be very informative to the analyst. However each graphical representation type relates to a specific mathematical function.

Filed Under: Articles, on Maintenance Reliability, The Reliability Mindset

About André-Michel Ferrari

André-Michel Ferrari is a Reliability Engineer who specializes in Reliability Analytics and Modeling which are fundamental to improving asset performance and output in industrial operations.

André-Michel has approximately 30 years of industrial experience mainly in Reliability Engineering, Maintenance Engineering, and Quality Systems Implementation. His experience includes world-class companies in the Brewing, Semiconductor, and Oil & Gas industries in Africa, Europe and North America.

« What is GR&R
Leveraging Bayesian Statistics for Reliability Predictions with Limited Sample Data »

Leave a Reply Cancel reply

Your email address will not be published. Required fields are marked *

The Reliability Mindset logo Photo of André-Michel FerrariArticles by André-Michel Ferrari
in the The Reliability Mindset: Practical Applications in Industry article series

Join Accendo

Receive information and updates about articles and many other resources offered by Accendo Reliability by becoming a member.

It’s free and only takes a minute.

Join Today

Recent Posts

  • How a Mission Statement Drives Behavioral Change in Organizations
  • Gremlins today
  • The Power of Vision in Leadership and Organizational Success
  • 3 Types of MTBF Stories
  • ALT: An in Depth Description

© 2025 FMS Reliability · Privacy Policy · Terms of Service · Cookies Policy