
The root sum squared (RSS) method is a statistical tolerance analysis method. In many cases, the actual individual part dimensions fall near the center of the tolerance range with very few parts with actual dimensions near the tolerance limits.
This, of course, assumes the part dimensions are tightly grouped and within the tolerance range.
Setting tolerances well, using the best available data about the part(s) variation, allows creating designs that function well given the expected part variation. This is better for reliable performance. Also, the same method can be applied when the loads and stresses are normally distributed.
Check that assumption with you data first, of course.
In the root sum squared tolerances method, one assumes that the normal distribution describes the variation of dimensions. The bell-shaped curve is symmetrical and fully described with two parameters, the mean μ and the standard deviation σ.
[NOTE: Checkout the ebook Statistical Tolerance Analysis]
The variances, not the standard deviations, are additive and provide an estimate of the combined part variation. The result of adding the means and taking the root sum square of the standard deviations provides an estimate of the normal distribution of the tolerance stack. The formula to combine the standard deviations of the stack is
$$ \large\displaystyle \sigma_{sys}=\sqrt{\sum\nolimits_{i=1}^{n}{\sigma_{i}^{2}}}$$
where σi; is the standard deviation of the ith part and n is the number of parts in the stack.

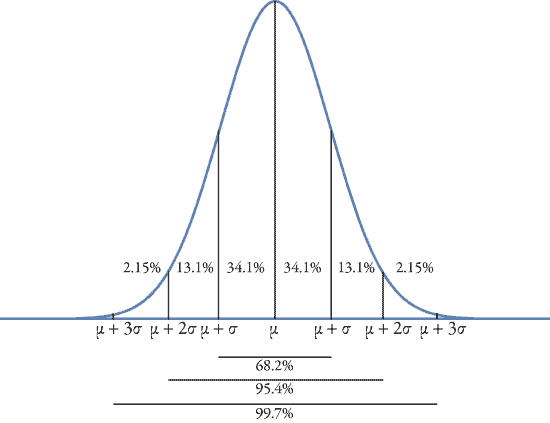
The normal distribution has the property that approximately 68.2% of the values fall within one standard deviation (1σ) of the mean. Likewise, 95.4% fall within two standard deviations (2σ), and 99.7% fall within three standard deviations (3σ). The plot above shows the probability for various regions relative to the standard deviations away from the mean.
Simple Example
Using the same example as with the worst-case method, we have five plates, each of which will have a different dimension. For any given set of five, we do not know the five individual dimensions, yet we can estimate what those dimensions will be using statistics.
On average, the plates are 25 mm thick. Assuming that each part will be slightly different than the average value and that the normal distribution describes the variation, we then need to estimate the standard deviation of the part thickness.
For this example let’s measure 30 plates and calculate the standard deviation. If we find that the standard deviation is 0.33 mm we know that most parts will have dimensions within the tolerance of 0.99 mm, if the parts follow a normal distribution (and how to check this assumption will be discussed later). This is our estimate of how the part thickness actually varies.
When you stack five blocks, the average thickness will 5 times the mean thickness, or 125 mm.
We expect approximately 99.7% of the stacks of five blocks to have the combined thickness to be within the range of plus or minus 3σ of the combined plates. To combine the standard deviations we use the formula to add the variances and convert back to standard deviation with a square root.
In this case, we add the five variances, 0.332, and take the square root of that sum:
$$ \large \displaystyle \sigma_{sys}=\sqrt{\sum\nolimits_{i=1}^{5}{0.33_{i}^{2}}}=0.7379$$
Since approximately 99.7% of the values are within ± 3σ, the range of combined thickness values for the stack of five plates should be within 125 ± (3 × 0.7379 or 2.2137) mm, or most fall between 122.79 and 127.21 mm.
To estimate the number of assemblies outside the desired tolerance we can use the system normal distribution values; in this case, the mean μ is 125, and the standard deviation σ is 0.7379. Within Excel, you can use the NORMDIST function. In general, construct the cell as follows:
=(NORMDIST(Mean+Tolerance, Mean, σsys)-0.5)*2
where the mean is that of the combined means of the parts involved in the stack. In this example the system mean is 125 mm.
The tolerance is the desired value. In this examples let’s assume that we would like the total stack to be within 2 mm of the mean, or a tolerance of 2.
σsys is the standard deviation of the combined parts found by using the RSS standard deviations of the parts involved.
We subtract 0.5 to find the one-sided probability of the result, being below the maximum value (mean plus tolerance), and we multiply the resulting probability by 2 to find the chance that the final assembly is either above or below the desired tolerance.
In this example, for a tolerance of 2 mm, we would expect 99.33% of assemblies to have a thickness within 125 ± 2 mm. This implies that we should expect one assembly out of about 300 to result in a thickness either thinner than 123 mm or thicker than 127 mm.
By varying the tolerance in the calculation we can estimate the scrap or defect rate and compare the cost of scrap and failure to the cost of tighter individual part tolerances.
Best Practices and Assumptions
The normal distribution assumption relies on the process variation having many small perturbations that generally add to create the final dimension. It is best to actually measure approximately 30 samples to estimate the mean and standard deviation.
When gathering measurements is not feasible, then assuming that the parts will have dimensions centered within the tolerance range and have ±3σ across the tolerance range is a conservative starting assumption. Of course, this implies that the part creation process is capable of creating 99.7% of the parts within the tolerance specifications.
If measuring fewer than 30 parts to estimate the standard deviation, be sure to use the sample standard deviation formula.
$$ \large\displaystyle \sigma=\sqrt{{{\sum\nolimits_{i=1}^{N}{\left({x_{i}-\overline{x}}\right)}^{2}}\over{N-1}}}$$
where N is the number of samples, xi is the ith measurement, and x̄ is the sample mean of the samples.
Related:
Reliability and tolerance Analysis (Recorded Webinar)
Why do Tolerance Analysis (article)
Reliability and Monte Carlo Determined Tolerances (article)

This quick introduction to three statistical analysis methods enables you to quickly determine or assess part tolerances. Plus, you will learn why tolerances are critical to achieving a reliability product or system.
[hide_from visible_to=’public’]Please login with your site registration to immediately download this ebook which includes step by step examples and details on the data you need to get started today.
Login[login_form redirect=”reliability-tolerance-analysis”]
If you haven’t registered, it’s free and takes only a moment.
[/hide_from][show_to accesslevel=’free’]Thanks for being logged in, you can download this 75-page (1 MB) ebook directly here.
PDF Download
[/show_to]

Great article except that it looks like you need to square the (measure – mean) term in the sample standard deviation formula.
Thanks!
Thanks for letting me know Lloyd and thanks for the kind words, too.
Corrected.
Cheers,
Fred