Accendo Reliability

Your Reliability Engineering Professional Development Site

  • Home
  • About
    • Contributors
    • About Us
    • Colophon
    • Survey
  • Reliability.fm
  • Articles
    • CRE Preparation Notes
    • NoMTBF
    • on Leadership & Career
      • Advanced Engineering Culture
      • ASQR&R
      • Engineering Leadership
      • Managing in the 2000s
      • Product Development and Process Improvement
    • on Maintenance Reliability
      • Aasan Asset Management
      • AI & Predictive Maintenance
      • Asset Management in the Mining Industry
      • CMMS and Maintenance Management
      • CMMS and Reliability
      • Conscious Asset
      • EAM & CMMS
      • Everyday RCM
      • History of Maintenance Management
      • Life Cycle Asset Management
      • Maintenance and Reliability
      • Maintenance Management
      • Plant Maintenance
      • Process Plant Reliability Engineering
      • RCM Blitz®
      • ReliabilityXperience
      • Rob’s Reliability Project
      • The Intelligent Transformer Blog
      • The People Side of Maintenance
      • The Reliability Mindset
    • on Product Reliability
      • Accelerated Reliability
      • Achieving the Benefits of Reliability
      • Apex Ridge
      • Field Reliability Data Analysis
      • Metals Engineering and Product Reliability
      • Musings on Reliability and Maintenance Topics
      • Product Validation
      • Reliability by Design
      • Reliability Competence
      • Reliability Engineering Insights
      • Reliability in Emerging Technology
      • Reliability Knowledge
    • on Risk & Safety
      • CERM® Risk Insights
      • Equipment Risk and Reliability in Downhole Applications
      • Operational Risk Process Safety
    • on Systems Thinking
      • Communicating with FINESSE
      • The RCA
    • on Tools & Techniques
      • Big Data & Analytics
      • Experimental Design for NPD
      • Innovative Thinking in Reliability and Durability
      • Inside and Beyond HALT
      • Inside FMEA
      • Institute of Quality & Reliability
      • Integral Concepts
      • Learning from Failures
      • Progress in Field Reliability?
      • R for Engineering
      • Reliability Engineering Using Python
      • Reliability Reflections
      • Statistical Methods for Failure-Time Data
      • Testing 1 2 3
      • The Manufacturing Academy
  • eBooks
  • Resources
    • Accendo Authors
    • FMEA Resources
    • Glossary
    • Feed Forward Publications
    • Openings
    • Books
    • Webinar Sources
    • Podcasts
  • Courses
    • Your Courses
    • Live Courses
      • Introduction to Reliability Engineering & Accelerated Testings Course Landing Page
      • Advanced Accelerated Testing Course Landing Page
    • Integral Concepts Courses
      • Reliability Analysis Methods Course Landing Page
      • Applied Reliability Analysis Course Landing Page
      • Statistics, Hypothesis Testing, & Regression Modeling Course Landing Page
      • Measurement System Assessment Course Landing Page
      • SPC & Process Capability Course Landing Page
      • Design of Experiments Course Landing Page
    • The Manufacturing Academy Courses
      • An Introduction to Reliability Engineering
      • Reliability Engineering Statistics
      • An Introduction to Quality Engineering
      • Quality Engineering Statistics
      • FMEA in Practice
      • Process Capability Analysis course
      • Root Cause Analysis and the 8D Corrective Action Process course
      • Return on Investment online course
    • Industrial Metallurgist Courses
    • FMEA courses Powered by The Luminous Group
    • Foundations of RCM online course
    • Reliability Engineering for Heavy Industry
    • How to be an Online Student
    • Quondam Courses
  • Calendar
    • Call for Papers Listing
    • Upcoming Webinars
    • Webinar Calendar
  • Login
    • Member Home
  • Barringer Process Reliability Introduction Course Landing Page
  • Upcoming Live Events
You are here: Home / Articles / Reading a Standard Normal Table

by Fred Schenkelberg Leave a Comment

Reading a Standard Normal Table

Reading a Standard Normal Table

Editing and Contributions by John Healy

Before computers and statistical software, we relied on tables to determine values for common integration problems – the normal distribution in particular. There is no closed form solution for the integral of the normal distribution probability density function, it requires advanced numerical methods to estimate the area under the curve.

The normal distribution has the very pleasant property that it can be normalized. By subtracting the mean and dividing by the standard deviation for each point of in the dataset, the results have a standard normal distribution. The standard normal has a mean of zero and standard deviation of one. This means that if you can estimate the area under the PDF for a standard normal distribution, you can estimate the area under the PDF for a normal distribution with any mean or standard deviation.

Most statistics books, and many reliability engineering books include a standard normal table in an appendix.

The issue is each author may present the table in one of many manners.

There is not a “standard” standard normal table

A quick check in a few books found three different layouts for the table. The key is to check the small sketch of the normal curve with a z-value indicated on the x-axis and a shaded in the area under the curve. The shaded area represents the area under the PDF given in the body of the table. It is the probability that a standard normal random variable, Z, is less than or equal to the z-value, between the mean and the z-value or greater than or equal to the z-value.

The left column of all the tables contained the first two digits of the z-value. The top row contained the third digit. Together they represent the z-value. The body of the tables contains four or five digit numbers with values corresponding to the area represented by the shaded region, as the z-value changes.

The CRE primer table has a graphic similar to

z-table-graphic

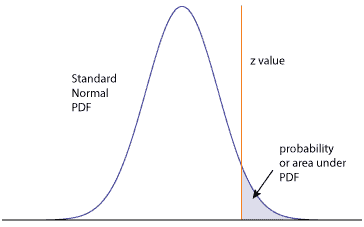
Thus the values in the body of the table provide the area under the PDF to the right of the z-value out to positive infinity. Generally, the table will have values from near zero to 0.5 (when the z-value is zero). The higher the z-value the smaller the area.

Let’s try to use this table to find some normal probabilities. For example, if we want to find the probability that a standard normal is greater than 1.45, the table will provide that value directly: P(Z > 1.45) = 0.0735. The total area under the curve is 1. This means that P(Z< 1.45) + P(Z >1.45) = 1 (note that P(Z= 1.45) = 0). As a result, if we want the probability that a standard normal is less than 1.45, we need to subtract the value in the table from 1:

P(Z < 1.45) = 1 – P(Z >= 1.45) = 1 – .0735 =0.9265

If we want the probability that a standard normal is greater than

-1.45, the number “-1.45” cannot be found in the table. Since a normal distribution is symmetric (looks the same on the right and left), the P(Z > -1.45) = P(Z< 1.45). We calculated the P(Z < 1.45) above. As a result we have: P(Z > -1.45) = P(Z < -1.45) = 1 – P(Z> 1.45) = 1 – .0735 = 0.9265

We can also calculate probabilities for a random variable with a nonstandard normal distribution. Let X have a normal distribution with mean 4 and standard deviation 8. Let’s find the probability X is greater than 5 using the table for a standard normal distribution. We know that (X-4)/8 has a standard normal distribution. As a result, we have:

P(X>5) = P((X-4)/8 > (5-4)/8) = P((X-4)/8 > 1/8) = P(Z > .125) = .4503

My trusty statistics book has the following graphic:

z-NormalTableMidpointToZ

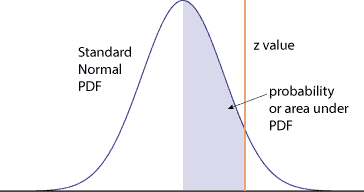
Here the value is from the midpoint or mean to the z-value. To the left of the mean is an area of 0.5 from negative infinity to the mean. The table will have values ranging from zero to 0.5. The larger the z-value the higher the value. We can calculate the probabilities for standard and nonstandard normal distribution using this table in a similar manner to what we showed for the table from the CRE primer.

The Juran’s Quality Handbook has the following graphic,

z-NormalTableAreaLessThanZ

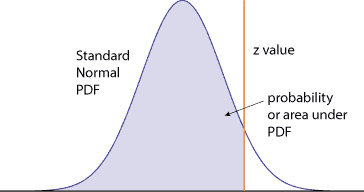
which is the complement of the one found in the primer, and the table provides the area under the curve from negative infinity up to the z-value. The values in the table will range from 0.5 when the z-value is zero or corresponding to the mean up to one. Typically the table will only consider values with positive z-values.

Similar to what we showed for the CRE table, you, with some practice, can find the value you need with some manipulation. A good practice is to draw a small normal curve and shade in the area that you need to solve the problem. Then using the table, find the corresponding area and value.

Some general ideas to keep in mind: The total area under the PDF is one. The value to the left or right of the midpoint, or mean, out to infinity is 0.5. Also, the normal curve is symmetrical, so keep track of the signs of the z-value for the calculations (negative values represent values to the left of the mean). The area above 2.0 z-value is the same as the area below -2.0 z-value.

One note as you prepare for the exam – get used to a specific table and have that table with you during the exam. It only takes simple error to find the wrong answer.


Related:

The Normal Distribution (article)

Point and Interval Estimates (article)

Calculating Lognormal Distribution Parameters (article)


Filed Under: Articles, CRE Preparation Notes, Probability and Statistics for Reliability Tagged With: Statistics distributions and functions

About Fred Schenkelberg

I am the reliability expert at FMS Reliability, a reliability engineering and management consulting firm I founded in 2004. I left Hewlett Packard (HP)’s Reliability Team, where I helped create a culture of reliability across the corporation, to assist other organizations.

« When to Stop Testing
Is Environmental Testing Part of Product Reliability? »

Leave a Reply Cancel reply

Your email address will not be published. Required fields are marked *

CRE Preparation Notes

Article by Fred Schenkelberg

Join Accendo

Join our members-only community for full access to exclusive eBooks, webinars, training, and more.

It’s free and only takes a minute.

Get Full Site Access

Not ready to join?
Stay current on new articles, podcasts, webinars, courses and more added to the Accendo Reliability website each week.
No membership required to subscribe.

[popup type="" link_text="Get Weekly Email Updates" link_class="button" ][display_form id=266][/popup]

  • CRE Preparation Notes
  • CRE Prep
  • Reliability Management
  • Probability and Statistics for Reliability
  • Reliability in Design and Development
  • Reliability Modeling and Predictions
  • Reliability Testing
  • Maintainability and Availability
  • Data Collection and Use

© 2025 FMS Reliability · Privacy Policy · Terms of Service · Cookies Policy