Accendo Reliability

Your Reliability Engineering Professional Development Site

Asset Management in the Mining Industry logo Photo of Miguel PengelArticles by Miguel Pengel
in the Asset Management in the Mining Industry: A Blueprint for Operational Excellence article series

Join Accendo

Receive information and updates about articles and many other resources offered by Accendo Reliability by becoming a member.

It’s free and only takes a minute.

Join Today

Recent Posts

  • Today’s Gremlin – It’ll never work here
  • How a Mission Statement Drives Behavioral Change in Organizations
  • Gremlins today
  • The Power of Vision in Leadership and Organizational Success
  • 3 Types of MTBF Stories
  • Home
  • About
    • Contributors
    • About Us
    • Colophon
    • Survey
  • Reliability.fm
  • Articles
    • CRE Preparation Notes
    • NoMTBF
    • on Leadership & Career
      • Advanced Engineering Culture
      • ASQR&R
      • Engineering Leadership
      • Managing in the 2000s
      • Product Development and Process Improvement
    • on Maintenance Reliability
      • Aasan Asset Management
      • AI & Predictive Maintenance
      • Asset Management in the Mining Industry
      • CMMS and Maintenance Management
      • CMMS and Reliability
      • Conscious Asset
      • EAM & CMMS
      • Everyday RCM
      • History of Maintenance Management
      • Life Cycle Asset Management
      • Maintenance and Reliability
      • Maintenance Management
      • Plant Maintenance
      • Process Plant Reliability Engineering
      • RCM Blitz®
      • ReliabilityXperience
      • Rob’s Reliability Project
      • The Intelligent Transformer Blog
      • The People Side of Maintenance
      • The Reliability Mindset
    • on Product Reliability
      • Accelerated Reliability
      • Achieving the Benefits of Reliability
      • Apex Ridge
      • Field Reliability Data Analysis
      • Metals Engineering and Product Reliability
      • Musings on Reliability and Maintenance Topics
      • Product Validation
      • Reliability by Design
      • Reliability Competence
      • Reliability Engineering Insights
      • Reliability in Emerging Technology
      • Reliability Knowledge
    • on Risk & Safety
      • CERM® Risk Insights
      • Equipment Risk and Reliability in Downhole Applications
      • Operational Risk Process Safety
    • on Systems Thinking
      • Communicating with FINESSE
      • The RCA
    • on Tools & Techniques
      • Big Data & Analytics
      • Experimental Design for NPD
      • Innovative Thinking in Reliability and Durability
      • Inside and Beyond HALT
      • Inside FMEA
      • Institute of Quality & Reliability
      • Integral Concepts
      • Learning from Failures
      • Progress in Field Reliability?
      • R for Engineering
      • Reliability Engineering Using Python
      • Reliability Reflections
      • Statistical Methods for Failure-Time Data
      • Testing 1 2 3
      • The Manufacturing Academy
  • eBooks
  • Resources
    • Accendo Authors
    • FMEA Resources
    • Glossary
    • Feed Forward Publications
    • Openings
    • Books
    • Webinar Sources
    • Podcasts
  • Courses
    • Your Courses
    • Live Courses
      • Introduction to Reliability Engineering & Accelerated Testings Course Landing Page
      • Advanced Accelerated Testing Course Landing Page
    • Integral Concepts Courses
      • Reliability Analysis Methods Course Landing Page
      • Applied Reliability Analysis Course Landing Page
      • Statistics, Hypothesis Testing, & Regression Modeling Course Landing Page
      • Measurement System Assessment Course Landing Page
      • SPC & Process Capability Course Landing Page
      • Design of Experiments Course Landing Page
    • The Manufacturing Academy Courses
      • An Introduction to Reliability Engineering
      • Reliability Engineering Statistics
      • An Introduction to Quality Engineering
      • Quality Engineering Statistics
      • FMEA in Practice
      • Process Capability Analysis course
      • Root Cause Analysis and the 8D Corrective Action Process course
      • Return on Investment online course
    • Industrial Metallurgist Courses
    • FMEA courses Powered by The Luminous Group
    • Foundations of RCM online course
    • Reliability Engineering for Heavy Industry
    • How to be an Online Student
    • Quondam Courses
  • Calendar
    • Call for Papers Listing
    • Upcoming Webinars
    • Webinar Calendar
  • Login
    • Member Home
  • Barringer Process Reliability Introduction Course Landing Page
  • Upcoming Live Events
You are here: Home / Articles / Optimizing Spare Parts Inventory: A Step-by-Step Guide to Calculating Minimum Quantities

by Miguel Pengel Leave a Comment

Optimizing Spare Parts Inventory: A Step-by-Step Guide to Calculating Minimum Quantities

Optimizing Spare Parts Inventory: A Step-by-Step Guide to Calculating Minimum Quantities

You don’t realise how important it is to get your critical spares holding right until your $50K/hr machine is sitting dead with an emergency part all the way in a different city.

So how does your warehouse ensure you have what you need, when you need it? Who decides how much to stock?
Well… in most cases on mining sites there is no real math behind this number, and that’s a shame considering how much not having spares costs us in lost opportunity.

In this article we will show you have to calculate the optimal level of spares holding for a required level of availability, in Excel using the Poisson distribution.

Before starting Step 1, it’s important to understand why the Poisson distribution is chosen for modeling spares. It is ideal for estimating required spares due to its ability to accurately represent the random occurrence of equipment failures and the resulting demand for spare parts. In this article’s model, we’ll calculate the failure rate for a chosen maintenance interval, determining the risk of needing corrective maintenance within that period.

This calculation helps in estimating the necessary corrective maintenance spares, upon which we use the Poisson distribution to ascertain the required spares for maintaining a specific level of availability.

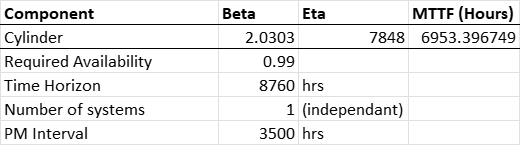
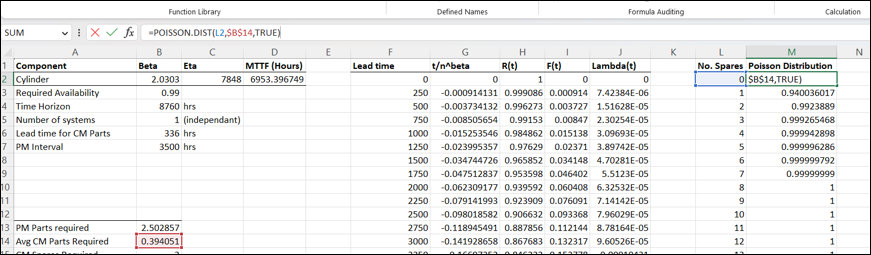
The table above provides essential data for creating the Spares model, incorporating Beta and Eta values from prior Weibull Analysis for Lambda (failure rate) calculation, targeting 99% spares availability over a 8760-hour annual operation period. The model’s output determines the annual spares requirement. Additionally, a Preventative Maintenance (PM) Interval of 3500 hours has been set for servicing the cylinders.

For the first step in calculating the optimal spares level, we must calculate the required spares for Preventative Maintenance (PM). This is the easiest calculation because if I plan to replace a cylinder every 3500 hours, I will plan to replace 8760/3500 = 2.5 cylinders per year. In reality this can be rounded to 3 because we can’t have half-spares, but because we’re adding the Corrective Maintenance spares allowance on later, we will keep this value exact so that the final number is more in-line with the risk profile.

Next, we will calculate the failure rate from our Beta and Eta values to quantify the risk of failing a part with an increase in maintenance interval. We’ve covered this calculation in depth in the Weibull Analysis article, however the formula to use is:

\[\lambda = (\frac) \times (\frac)^{(\beta -1)}\]

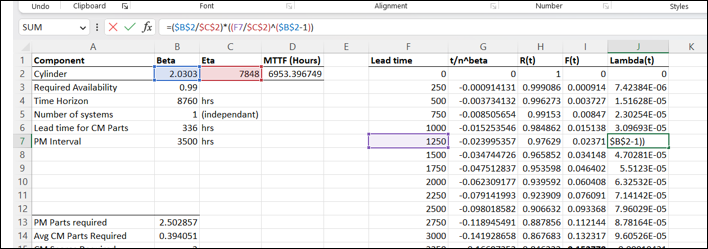
After having calculated our failure rate for each PM interval, we can highlight the 3500 hours row we initially determined as the interval we will be doing replacements. What is obvious is that as I increase my replacement interval, the risk of failure or Lambda will increase. To convert this to a tangible number of spares we just multiply the failure rate by the PM hours, 3500. Note this takes into account a single component system (so 1 cylinder).

\[CM Spares = \lambda \times PM Interval\]

In this example it comes out to about 0.3 of a spare part (again, don’t round this out to 1 just yet). This is known as the mean for the CM spares, and will be important in our next and final step.

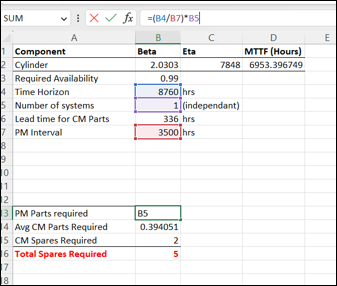
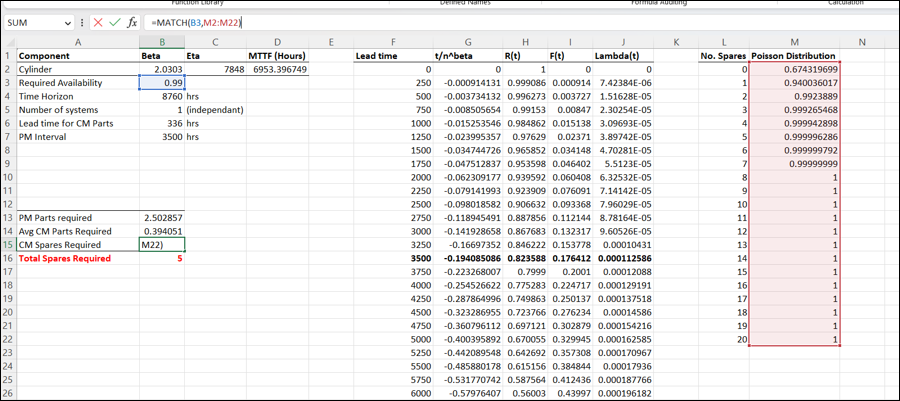
Now that we have a number for the required PM and mean CM spares, we need to adjust the mean CM spares number for the required availability we specified at the start (99%).

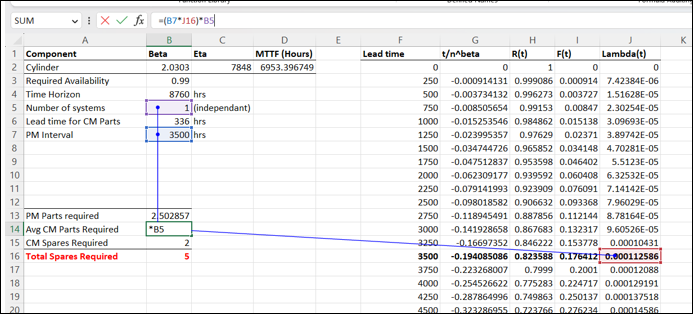
We use the Poisson distribution formula in excel where we fill in the number of required spares in increasing order, the mean CM Spares value, and TRUE- because we went a cumulative number for part availability. When we drag this formula down you will see that as I increase my spares holding, my part availability increases- logical.

What we then do is match the Poisson distribution values of availability to our 99% and select the corresponding number of CM spares using the MATCH function. We then add this number to our required PM parts and now we round up using the CEIL function. This now calculated we should hold 5 spares continuously to ensure we have sufficient parts available for preventative services and breakdowns. This number ensures we will have a cylinder in stock 99% of the time.

As you can see, calculating the required spares for a certain level of part availability isn’t technically arduous, however it is important to note a few caveats- namely that if the Beta and Eta values from your Weibull analysis are wrong, the spares will be way off as well.

You must also keep in mind that this calculation doesn’t take into account the lead time of the part from the manufacturer to your site, so the economic order qty and optimum stock level must also be calculated, however this is usually built into stores management software and falls outside the realm of the Reliability Engineer. This calculation shows how much you should have on-hand to ensure a part will be available when you need it, but if lead times are large, this number will increase as it needs to keep a minimum of 5 as in this example.

And finally, be realistic with the required part availability, as stock holding costs and space increase dramatically when you require a high level of part availability- this is also a cost optimization problem, which isn’t covered here, but follows the same principle as calculating optimal maintenance intervals covered in an earlier article. We don’t always require 99% part availability, and you’ll see that even in the above calculation, you can achieve 94% availability with only 1 CM spare, which may be enough in your case.

Original Article: Pardus Consulting Australia

Filed Under: Articles, Asset Management in the Mining Industry, on Maintenance Reliability

About Miguel Pengel

Miguel Pengel is a Registered Professional Engineer based in Australia, with experience in a wide variety of heavy industries such as Mining, Smelting and Power Generation.

He holds a degree in Mechanical & Aerospace Engineering, as well as a Masters in Applied Finance from the University of Queensland.

Miguel has worked in Reliability, Mechanical, Production and Project engineering roles for some of the world's largest companies such as Glencore, Hitachi and Rio Tinto.

« Data Storytelling Using Histogram
Correlation and Regression on Casio fx991-MS Calculator and Excel »

Leave a Reply Cancel reply

Your email address will not be published. Required fields are marked *

[popup type="" link_text="Get Weekly Email Updates" link_class="button" ][display_form id=266][/popup]

The Accendo Reliablity logo of a sun face in circuit

Please login to have full access.


Lost Password? Click here to have it emailed to you.

Not already a member? It's free and takes only a moment to create an account with your email only.

Join

Your membership brings you all these free resources:

  • Live, monthly reliability webinars & recordings
  • eBooks: Finding Value and Reliability Maturity
  • How To articles & insights
  • Podcasts & additional information within podcast show notes
  • Podcast suggestion box to send us a question or topic for a future episode
  • Course (some with a fee)
  • Largest reliability events calendar
  • Course on a range of topics - coming soon
  • Master reliability classes - coming soon
  • Basic tutorial articles - coming soon
  • With more in the works just for members
Speaking of Reliability podcast logo

Subscribe and enjoy every episode

RSS
iTunes
Stitcher

Join Accendo

Receive information and updates about podcasts and many other resources offered by Accendo Reliability by becoming a member.

It’s free and only takes a minute.

Join Today

Dare to Know podcast logo

Subscribe and enjoy every episode

RSS
iTunes
Stitcher

Join Accendo

Receive information and updates about podcasts and many other resources offered by Accendo Reliability by becoming a member.

It’s free and only takes a minute.

Join Today

Accendo Reliability Webinar Series podcast logo

Subscribe and enjoy every episode

RSS
iTunes
Stitcher

Join Accendo

Receive information and updates about podcasts and many other resources offered by Accendo Reliability by becoming a member.

It’s free and only takes a minute.

Join Today

Recent Articles

  • Today’s Gremlin – It’ll never work here
  • How a Mission Statement Drives Behavioral Change in Organizations
  • Gremlins today
  • The Power of Vision in Leadership and Organizational Success
  • 3 Types of MTBF Stories

© 2025 FMS Reliability · Privacy Policy · Terms of Service · Cookies Policy