
Barringer Process Reliability – Your factory performance on a single page!
Barringer Process Reliability (BPR) was developed by Paul H. Barringer, a fellow reliability engineer “extraordinaire” and an outstanding mentor for myself and countless others in this field of practice. BPR highlights operational issues. Not addressed and mitigated, those could have significant revenue impacts. A BPR analysis uses the Weibull probability plot which happens to be a very well-known tool in the field of Reliability Engineering. On one side of a sheet of paper only, the BPR plot can tell the true “story” on the operation.
The Weibull technique and BPR graphics provide important information useful to a plant operator attempting to quantify production losses and/or seeking to solve business problems. The shortfall in production output is also know as the “Hidden Factory”. One-page summaries as opposed to long reports, are very important for busy people, particularly senior leaders. Managers always look down on the process from a 10,000-foot level, and what they see matters differently than the field worker who is at the 1-foot level. By nature of their job and no fault to them, field workers always see the process from a low altitude where the view can be overwhelming due to a maze of problems.
BPR theory
The hardest part, yet the most important part, of any reliability analysis is getting the data. Fortunately, BPR only requires production data which is always available. Those could be an oil refinery’s daily production output or the number of widgets a factory produces daily. As it happens, production quantities are precursors for revenue. Therefore, restrictions in output is critical for every profit driven operation. In essence, BPR is about making businesses more efficient and more profitable.
Diagram 1 below illustrates 365 consecutive days of daily ore production in a plant. The plant design output was set at 1,500 tonnes per day. Shareholders, management and the workforce expect this output. However, the reality for a year’s production is different as shown in Diagram 1. One can observe the scatter of daily values and the inability to hit the design capacity. Also included in red, are the days when there is no production at all (zero days). Production shortfalls bog down the plant. This may inevitably lead to dissatisfied customers.

As mentioned earlier, the BPR process is based on the assumption that production output data follows a Weibull distribution. A Weibull distribution models the above-mentioned data. Diagram 2 below illustrates the model’s Probability Density Function (PDF). The PDF’s right most section shows that achieving design capacity is challenging The left side illustrates the lower production values. These are the days when things go wrong leading to a reduction or interruption in production. In addition, the wide spectrum of values also illustrates the variability in production. The “Hidden Factory” in other words.

Obviously, there could be better distributions than a Weibull distribution that fit the data. But the particular advantage of this specific distribution is the ability to obtain straight lines. Straight lines simplify the visualization of the data in a classical Cumulative Density Function (CDF) log/log plot as shown in Diagram 3. Engineers like to work with straight lines. The mathematical construction of the straight line is provided below. Beta is the shape parameter and Eta the scale parameter in a 2 parameter Weibull distribution defined for a variable “x”.
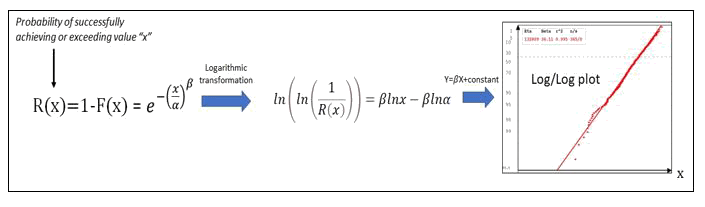
Hence the transformed CDF plot above becomes a straight line, with a slope Beta and a Characteristic Value Eta. Depending on the values of Beta, the point scatter or variability changes. The higher the beta value, the lower the variability and inversely.
BPR example
We have data, a Weibull plot, straight lines and Weibull parameters. Where does BPR come into play?
In relation to the above factory data, we construct the BRP plot below. This is the ore factory on a single page. The graph provides a lot of information on the incurred losses as well as key performance indicators highlighting the efficiency of our process.

The main performance indicators are:
– The factory has a demonstrated capability highlighted by a Weibull distribution (Beta=5.237, Eta=1004.9 tonnes). This is the operation’s best range of performance. It is still far from the 1,500 tonnes design capability.
– R=92%. In the BPR jargon, this is the “Process Reliability” value. The factory has a 92% chance of being in its demonstrated capability mode (“doing ok”). Therefore, an 8% chance of being in a low performance mode – the “Crash and Burn” mode.
– The output variability is high. This correlates with a low Beta value (5.237). Highly consistent outputs in world class operations would see a Beta value closer to 100. The variability range highlighted at the bottom right, varies between 300 and 1,450 tonnes/day. A fixed tonnage of ore promised to customer every day might not be achievable.
– The Crash and Burn or Reliability Losses are measured against the Capability Line. Those cost this plant 9,695 tonnes for this 365-day period. If the revenue collected from a tonne of ore was $100 then the lost revenue would be around $1M per year. Zero days increase Crash and Burn losses significantly as they increase the area of the yellow section.
High variability and losses incurred indicate this is a poor performing plant. Any production unit lost today is lost forever!
Paul Barringer quoted the following: “The ultimate aim of a business is satisfying customers with on time deliveries of quality products whilst producing satisfactory long term returns for the shareholders.” His BPR process is a robust tool that allows reliability professionals to analyze, quantify and benchmark the performance of an operation at a high level using readily available production output data. From it, KPIs such as Capability or Variability, can better reflect the nature of a production output. The losses incurred and inefficiencies are opportunities for improvement. They can be addressed using methods such as Root Cause Analysis or Six Sigma.

I would be interested if someone would be keen to show me how to do this on my assets (offshore production platforms).
derekbrown202@hotmail.com
Hello Derek. Glad to know the article was of interest to you. I’d be more than happy to collaborate with you on this. You can connect with me on cogito.reliability@gmail.com or on Linkedin (Andre-Michel Ferrari).
Hi Andre,
The assumption of Weibull distribution data fit may be acceptable but “Highly consistent outputs in world class operations would see a Beta value closer to 100” is debatable.
Basically, it is a Weibull analysis and $$$Loss link to Unreliability!
Thanks for your comments and your interest in my article. Debate is good and enriches the learnings. This is the classification of Beta Values made by Paul Barringer, the inventor of BPR
Poor control: β = 5
Fair control: β = 9
Tighter control: β = 27
Excellent control: β = 50
World Class control: β = 100
Seldom achieved: β = 200