In most industries we ideally want the lowest-cost maintenance strategy, one that balances risk of unplanned vs planned maintenance costs to a lifetime minimum.
This is what we’ve calculated in a previous article HERE, and this article/exercise is a follow-on from this.
The downside of using this method is that it may select a maintenance interval where the inherent reliability of the component at changeout time is less than is required for operational reasons, or that we’re not getting the best “increase in reliability vs marginal cost” value.
This brings us to three types of maintenance intervals:
– Optimal Interval for the lowest lifecycle cost
– Optimal Interval for the best reliability vs marginal cost trade-off
– Interval set for the required component reliability
Read more: Maintenance Tactics: A Practical Guide to Balancing Cost, Reliability, and RiskI this article, we will be covering these three main types cost vs risk maintenance strategies, how they are quantified, and when to use them. We will delve through some practical exercises to show how the model and calculations fit together.
During this exercise we will also put dollar figures to maintenance strategy choices, as in reality, this is the simplest and most effective way of communicating cost-benefit to management.
The worked Excel sheet can be downloaded after filling in the form at the end of the article, and is recommended to do so before working through this article for a better understanding.
Optimal Interval for the lowest lifecycle cost:
This strategy is usually most Reliability Engineer’s their go-to. If achieving the lowest maintenance cost of a component, while balancing the cost of downtime is the goal, then this is the method to use.
Here we calculate the cost of planned maintenance, as well as the cost of corrective (unplanned) maintenance and calculate the combined cost for each successive maintenance interval.

As the maintenance interval increases, the risk of failing the component also does (if Beta >1), and this factor is included in the cost calculation.

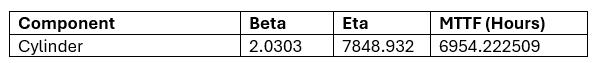
This cost associated with failure risk is derived from the results in the Weibull Analysis done HERE, and the Beta and Eta values have been carried over into this exercise to help with the calculations.
When equalizing this into a cost/hr, we will get a minimum, which is the maintenance interval at which we will achieve the lowest cost over the life of the part. In our case, this is at 3,500 hours.

Because cost/hr is sometimes not as clear as just one simple value, we can use the below method to calculate the total cost of each interval, and subsequently, the cost difference between the “lowest-cost” interval, and any other possibly interval.
This is done by multiplying the Cost/Hr of each respective interval by the interval value itself to get the “Total Cost” and subsequently proportioning it by the amount this interval fits into the Lowest Cost Interval of 3,500 hours. This is the “Cost during Life” column in the Excel sheet. When calculating the “Cost during Life”, you need to use the Optimal cost interval as the expected life. This is because we will assume you will adopt this interval, and all your cost-benefit comparisons will thus be based off this number.
After this we simply subtract each maintenance intervals Cost during Life by the one at 3,500 hours to get the total deviation. This plot is shown below and has the same shape as the cost/hr chart covered above

The problem with this method is that the optimal interval in terms of cost might be associated with a reliability value that is unacceptable. In our example, the optimal interval of 3,500 hours equates to a reliability of only 82%. Now this may be OK depending on your circumstances, however keep the following points in mind:
- Reliability of 82% for a component in a parallel circuit where it has redundancy will still ensure the “system” function has a higher reliability. So its important to consider if this component is in series, or has redundancy.
- If the component is in series, 82% might not be enough. Examples include safety critical systems such as airbags, ejection seat cartridges, isolators. These sort of systems require a high level of reliability that the lowest cost maintenance/ replacement interval might not satisfy
- Mining production targets and budgets are usually built around availability targets of the equipment. This is because it is important that the machine is available to extract commodities for a certain percentage of available operations time. No use saving a few thousand dollars in maintenance if it results in millions in lost production.
Optimal Interval for the best reliability vs marginal cost trade-off
This interval is the best “bang-for-buck”, and is not the lowest cost, or the highest reliability, but balances the trade-off between the two. Before we delve into calculating this one, let’s conceptually understand why this exists using our excel example as a reference.
In the previous calculation, we got the lowest cost maintenance interval. But let’s have a closer look at the excess cost of deviating from this interval, and the associated reliability.
If I dropped my maintenance/ replacement interval from 3500 hours to 1000 hours, I would have a cost deviation of $76,300, with a reliability increase from 82% to 98 %.
If I were to go from 1000 hours to 500 hours, the costs exponentially shoots up to $218,000 and reliability only goes up to 99%. So, an almost double increase in cost for only 1% increase in reliability.
What’s happening here is that because we have a Beta value of more than 1, and the part is experiencing wear-out failure, and the failure risk cost increases exponentially with time.
Thus, for every decrease in maintenance interval, we will experience diminishing returns when comparing the increase in component reliability with increase in maintenance costs from this reduced interval.

There is of course an optimal trade-off here, and that value is when the value of “failure risk saving” minus “excess cost of maintenance” is highest. What this means is that in order to have the best reliability vs cost trade off, the cost of our increased reliability (that is, the more frequent maintenance intervals) should always be less than the marginal savings associated with the reduced failure risk.
Graphically, this is shown in the figure below in the etched area of cross-over when plotting excess cost from optimal vs failure risk cost saving.

The absolute optimum is where this value is maximized, and is shown in the figure below, and sits at about 2250 Hours.

Interval set for the required component reliability
This is the simplest interval, and is used when we must achieve a minimum reliability. This is mainly used for safety critical components.
We simply use the derived Reliability Function that we got out of our Weibull Analysis, select the target reliability and locate the corresponding Hours. This is your minimum interval, and probably isn’t going to be the lowest cost, or the best reliability vs cost trade-off, but that’s all that you have to work off in this sort of situation.
Conclusion
As a Reliability Engineer, remember that your role is to “Engineer”. This means developing the most optimal solution dependent on the constraints set before you. As we’ve seen, sometimes having the lowest cost maintenance interval can’t be the answer, and we must adapt our maintenance tactics to balance cost, availability and risk.
The worked Excel example can be downloaded at the bottom of the original article HERE.

Leave a Reply