This is an example of a practical DOE that was used in the development of a manual window mechanism for a truck application. A similar process can be used for current mechanical and electrical design and development projects. In this article, you will see that the DOE method:
- is superior to the design-test-fix cycle
- builds knowledge of which factors are important to product performance
- quantifies the effect of a combination of factors
- allows performance prediction
Background
Joe, an engineer, was responsible for a manual window design and development project. The window was failing functional testing because cranking efforts were too high.. The time available to redesign and verify the product was quickly running out. Joe approached me to see if statistical methods could help. We held a brainstorming session where the engineering specifications and the design were reviewed.
The specification allowed a maximum 20 in-lb of cranking torque with a 13 in-lb design target. Testing showed that 25 in-lb were required and that the customer would be unhappy with the cranking efforts. Since there wasn’t a model that would predict the torque requirements, I suggested a DOE approach to evaluate the affect design factors had on cranking efforts.
Design Factors
After reviewing the design, five features were selected for testing. These were the regulator (crank) diameter, a lift finger width, the glass runner, and inner and outer belts. The regulator diameter transfers the torque to the window mechanism to crank the window. The lift finger attached the glass to the mechanical parts. The glass runner controlled the glass orientation during vertical travel. The inner and outer belts were rubber seals that pressed against the window to prevent water leaks into the door.
These five design features were called factors in the DOE. Each was tested with two levels, table 1.
Table 1
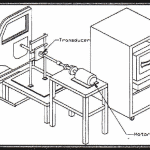
The parts could be assembled into a door and tested using a simple test fixture, figure 1. There were two response variables, the maximum torque required to crank the window up or down.

Figure 1
Once prototype parts were available and assembled into a door, the responses were easy to measure. A full factorial was used to test all 32 possible combinations of 5 design factors at 2 levels each. Each test combination was replicated 3 times for a total of 96 tests.
Test Restrictions
The new regulator and glass runners needed special fabrication by suppliers, but were not immediately available. Complete randomization of the tests could not be achieved. Parts would become available over a span of a few weeks, so the test was run in three stages, dictated by the part availability, table 2.

Table 2
The factor levels were coded in table 2 to provide a compact way to layout the test patterns. The codes are defined in table 1. Within each stage of testing, the test order was randomized.
Analysis of Variance
The ANOVA results for torque while cranking the window up are shown, tables 3.

Table 3
Note that the regulator, the glass runner, the lift finger and the outer belt are statistically significant for cranking up torque. The inner belt had no effect.
The ANOVA results for torque while cranking the window down is shown, tables 4.

Table 4
Note, that the same factors were significant for up and down torque.
Average Performance and Main Effects
The average torque to raise the window was 17 in-lbs. A main effects plot is used to display the factor level effect, figure 2.

Figure 2
The strain gauges indicated positive torques when raising the window. To minimize the torque when raising the window, select the level with the minimum value for each factor, i.e., the new regulator (21 mm), the glass run with new hinge points, and the outer belt with 1 lip. The finger width and the inner belt legs (lips) were of minor importance.
The average torque required to lower the window was 14.5 in-lb. The main effects plot to lower the window is shown, figure 3.

Figure 3
When lowering the window, the applied torque is reversed so the strain gauges show negative numbers. The average torque required to lower the window was -14.5 in-lbs. To select factor levels that minimize the torque, select the level that yields the smallest negative torque value. The factor levels selected matched the up torque selection.
Average effort and the factor effects changed with the direction. When raising the window, some of the torque is used to lift the window. However, when lowering the window, weight of the window assists the motion and less torque is required. The effects are summarized in table 5.

Table 5
Prediction and Confirmation
The torque required to raise the window was 11.6 in-lbs. This was calculated by combining the average and main effects plot information in table 5. Similarly, the torque required to lower the window was 8.95 in-lbs. Since the DOE was a full factorial, the optimal factor level combination was included in the test pattern, and confirmed the up and down torque requirements.
The results were presented to management and went into production. The window efforts beat the design targets and were considered best-in-class for world class quality.
Conclusions
- A full factorial DOE was used to evaluate all design combinations.
- Randomization could not be achieved during the testing, but did not appear to affect the test results.
- ANOVA tables allow significant factors to be identified as the regulator, the glass run, and the outer belt legs.
- Main effects plots allow selection of significant design factor levels to achieve design goals.
- Combining the average and the main effects allowed the optimal performance to be predicted.
If you have questions, please ask and I will get back to you with an answer.
Dennis Craggs
Big Data, Quality, and Reliability Consultant
810-964-1529

Leave a Reply