
Guest Post by Andrew Sheves (first posted on CERM ® RISK INSIGHTS – reposted here with permission)
Most of the risk assessment models I’ve discussed before use a basic formula to calculate a value for risk. By adding or multiplying values for the individual factors, you’ll get a numeric value for the risk itself. That’s going to allow you to put things into order, apply a color-code or description. That gives you enough differentiation to start a risk-based discussion or determine where you need to focus your attention and resources.
This model works, and it works well so, even though we aren’t weighing risk – remember, our assessment is more like a thermometer than a scale – we have a useable set of values we can use for our decision-making.
There’s just one problem.
We’re looking into the future and having to think about situations that might happen. Risks are potential events that might occur: if the building is already on fire, we’re not dealing with a risk anymore, that’s an issue.
And the obvious problem with the future is uncertainty. There are very few things that we can forecast with absolute conviction. And the farther out we are trying to look, the less certain things can be.
So our risk assessments always have a degree of uncertainty or fuzziness built-in.
Past is precedent (unless it isn’t)
Typically, we use previous events, patterns, and trends to help determine what normally happens, and these data give us some sense of what is likely to occur in the future. That works in the vast majority of cases, the exception being a true ‘black swan’ even where the previous data gives no indication that a catastrophic situation could occur.
(As an aside, I know NN Taleb argues that some of this is bunkum and what happened yesterday doesn’t help us predict what’s going to happen in the future. And I agree that yesterday isn’t always a good predictor of tomorrow but in many cases there are patterns that are helpful. As long as we recognize that there are outliers and unpredictable events that exist alongside what’s normal, then we can and should still use history as a guide.)
Black swans aside, previous events, trends, and data give us the input we need for our assessments and this is what we work with the majority of cases. However, there are times when the data aren’t accurate, or we have reduced confidence. So we now have uncertainty about the future, and uncertainty about the data.
Things get fuzzy.
Luckily, there’s an app for that or, in this case, a branch of logic and mathematics.
This might be one of those times when you’re thinking, ‘I was told there would be no math! What about KISS?’
Why we need to think about fuzziness
I accept that some of what follows is not as straightforward as a basic risk = likelihood x impact calculation. However, it’s worth thinking about fuzziness for three reasons
The first is that this is a real problem that risk managers face all the time, so we need a tool to deal with it.
The second reason is that there is a difference between uncertainty and fuzziness. With uncertainty, we might have poor or limited data and that makes decision-making difficult. With fuzziness, we might have very good data, but data that still create a spread. We can use that to help make decisions if we apply the right tools.
And the third reason is that it’s fun because you get to use the word ‘fuzzy’ as a technical term.
It’s worth stressing that I’m not a mathematician (hopefully you’ve picked that up by now) but even though what I’m about to cover might seem like a lot of math, it isn’t. The underlying calculations are no more complicated than anything you’d do using something r = tvi in a basic risk assessment.
By the way, if you are a math whizz and spot something here that’s incorrect, please let me know!
I’m going to try to make this explanation straightforward and KISS (as much as you can when you get into this kind of topic).
Fuzziness in the risk assessment
The basic premise of fuzziness in this context is that there’s uncertainty in the data because there’s a wide spread of valid values.
So the basic calculation might be the same, for example, risk = likelihood * impact, but each factor no longer has a single value.
Rather, we have some uncertainty in our data which gives us a spread of values for likelihood and impact. Instead of simply multiplying the two factors using a single value, we now have to calculate several different combinations.
This is what a calculation might look like where we have more certainty and consistency in our data. (I’m using a risk = likelihood times impact and 1 – 5 scale for these examples.)
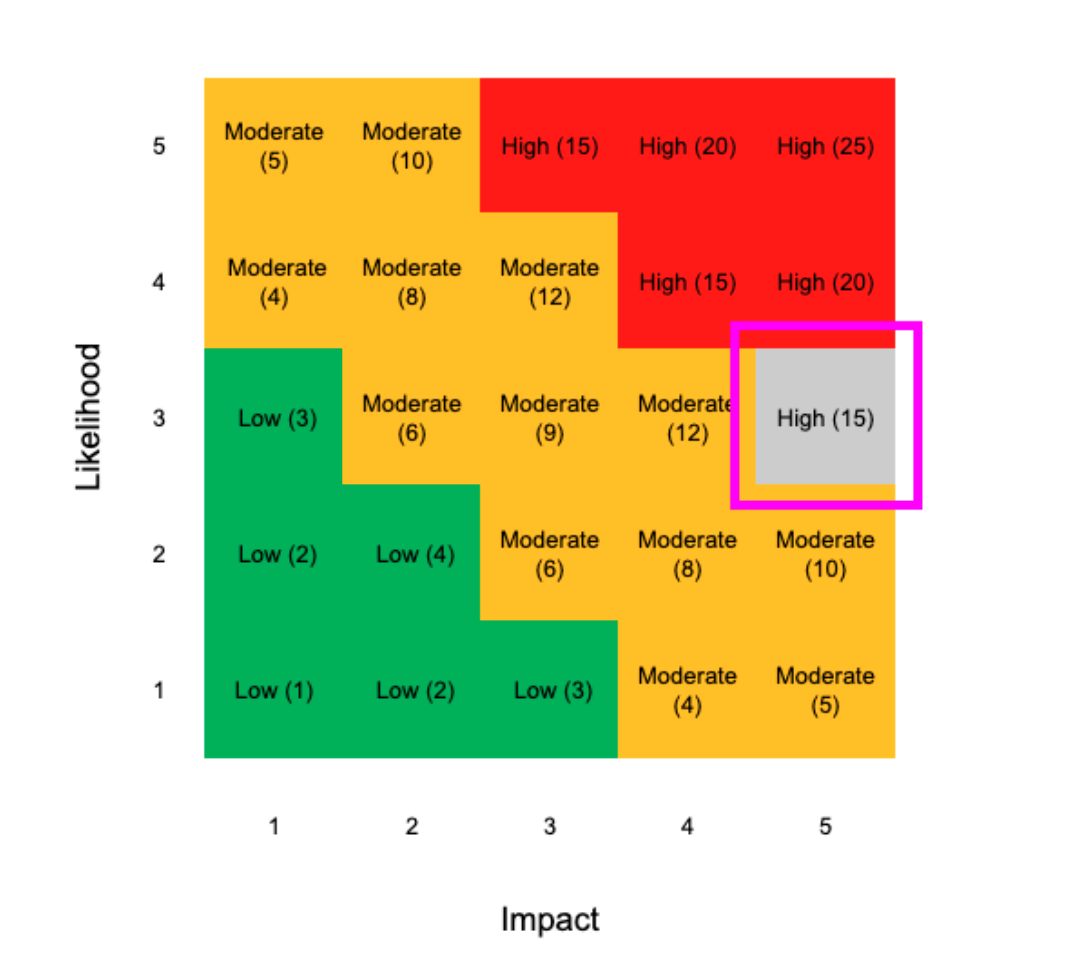
Likelihood = 3, Impact = 5, therefore risk = 3 * 5
This gives you 15 out of a possible maximum of 25
This is the kind of result you are probably used to seeing in your own risk assessments and similar to examples and models I’ve used before.
However, if we have some uncertainty or fuzziness in our data, we might have a spread of values. Therefore, likelihood could be 2 or 3, and impact could be 4 or 5.
Therefore, risk = (2 or 3) * (4 or 5)
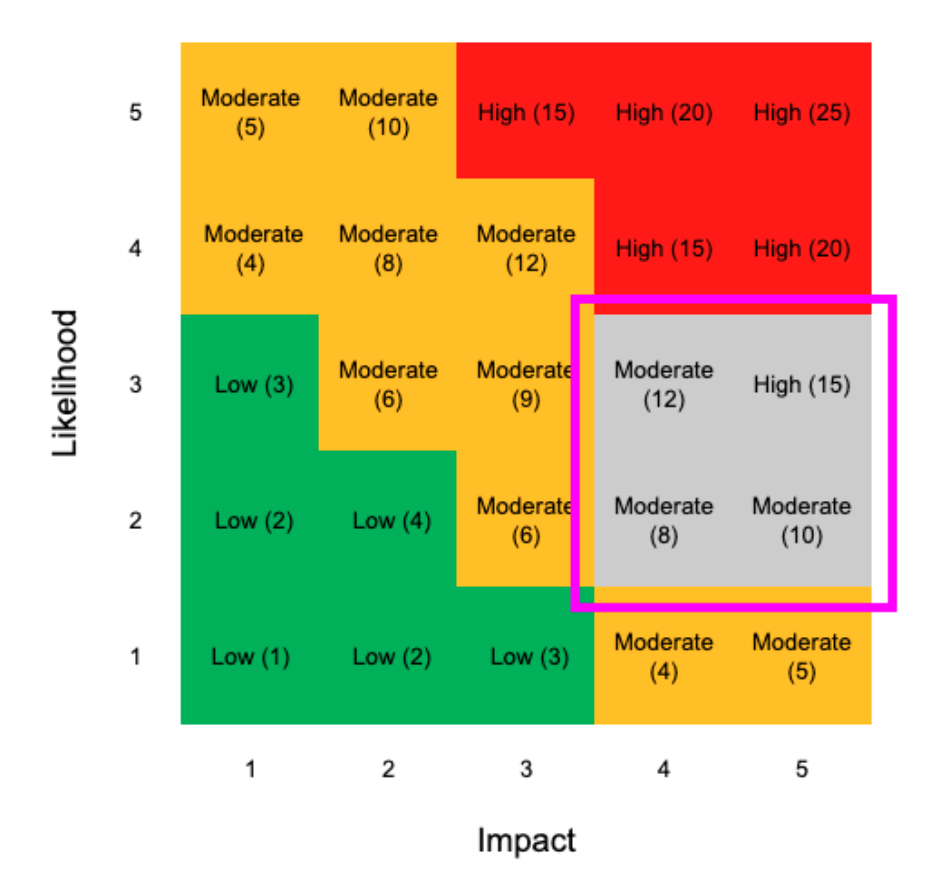
This gives you a spread of results for risk of 8, 10, 12, or 15 out of a possible 25.
Now, instead of having a single value, we have four values with a spread of 7, That’s a difference of 28% which is significant.
Although you probably aren’t as used to seeing this kind of result in your risk assessments, this kind of uncertainty and variation is probably a lot more realistic. If you think about the last time you conducted an assessment and were grading things, you probably didn’t have absolute consensus.
Instead, you will have taken all of the results and used the arithmetic average (the total /divided by the number of results) to determine a value.
But ask yourself, is that really representative of people’s opinions? And how does eliminating the outliers (worst and best case) help with risk management?
As a quick, silly example, if I like hot coffee and my friend likes iced coffee, the average is lukewarm coffee, which neither of us enjoys. Therefore, the average might be mathematically accurate but not very useful.
So even though working with the spread of values and representing these in your results is more complicated, it should give you a richer, more detailed picture of your risk environment. In turn, this gives you a better understanding of your situation, which should lead to better decisions.
However, this does make things more complicated and, after all, this is KISS Risk Management, so we need a KISS approach fuzziness.
A KISS perspective on fuzziness
First, determine if you have a data set where there’s some variation or maybe a couple of outliers, versus a data set that’s just too scattered to be meaningful. A simple way to do this is to put all the information into a graph or plot the spread. This will let you see if there’s a cluster or grouping somewhere which indicates that you have something you can work with.
The lack of a cluster might mean that the question was too broad, that there’s no pattern, or that the data set wasn’t big enough. That’s not a reason to ignore the results, but you might want to look for ways to narrow things down, or you might want to use that information more conceptually instead of trying to force it through the analysis process.
The second way to simplify things is to use the median, not arithmetic mean. By using the median, you can establish the central point of the data spread, rather than the mean which is easily skewed by big outliers. You still represent these outliers in the spread, so the over / under (for want of a better term) is still shown, but the value you get will be closer to the consensus of results, not skewed by an extreme value in either direction.
If we go back to our hot / iced coffee example but now let’s imagine we surveyed a bigger group. The median helps us see if people are tending in one direction on the scale between hot and iced. So instead of calculating an average of preferred temperatures, which will take us back into lukewarm territory, we can now see if there’s a tendency towards hot or cold. (Although it’s worth noting that you might still get a result that’s in the lukewarm territory.)
Third, use simple visuals to represent the results. There are several different tools and graphing models that allow you to illustrate a spread. Some are easy to read and intuitive, but others can take a minute to decipher. These graphs are a great way to share a lot of information but make sure that it’s clear to the reader what you’re trying to tell them.
Fourth and finally, ask yourself how much the spread actually matters. With a spread like the one in the matrix example above, if the results all fall under your risk threshold, then that’s an acceptable risk, no matter the outcome.
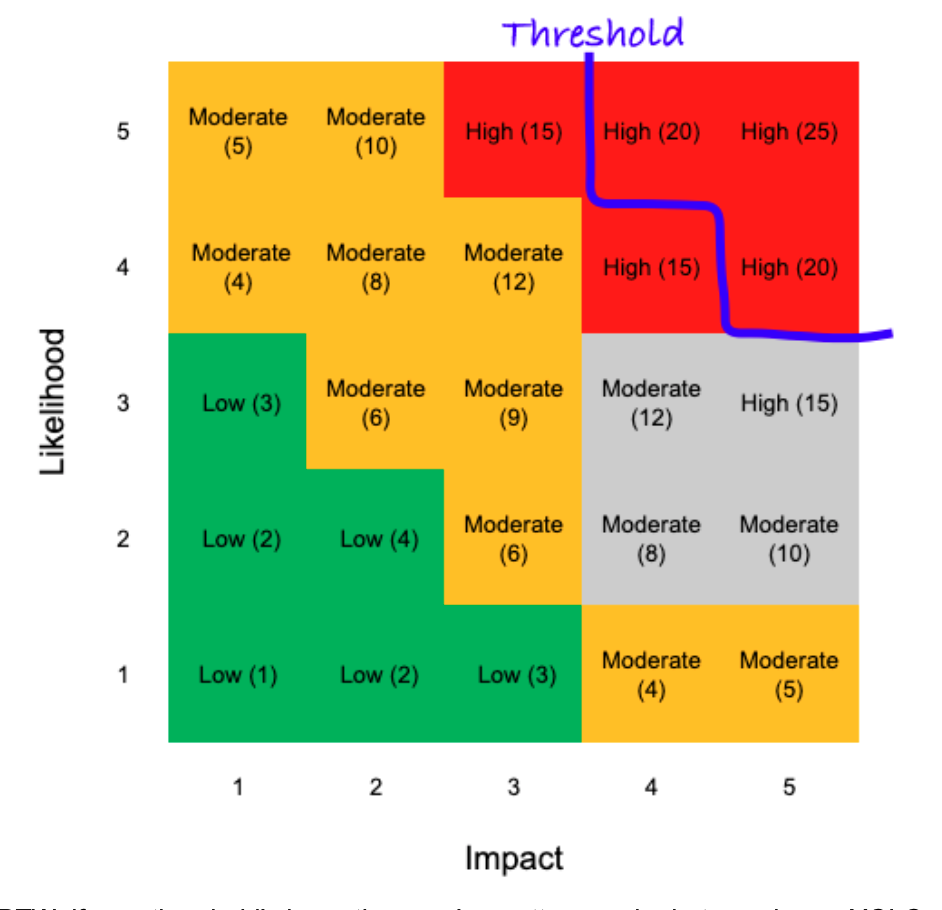
BTW, if your threshold’s here, then you’re pretty gung-ho but, you know, YOLO
Therefore, even though there’s still some variance in the risk, it’s still something that you can live with. For decision-makers, that might be sufficient.
In fact, they might be more comfortable with their decision knowing that whatever the outcome, the resultant risk is still acceptable. Similarly, knowing that there are significant uncertainties and a notable spread between the worst-case and best-case outcomes will help them determine the best way to manage that situation. This is much more useful than the false sense of security that a clean, single value based upon the arithmetic average produces.
In our coffee example, we just need a rough idea of the ratio of hot to iced coffee to order: we don’t need or expect a single answer that works for everyone.
I’ve still more work to do
As I noted above, I’m not a maths whizz and I think I’m just scratching at the surface of fuzziness and uncertainty here. If nothing else, I need to find a better way to lay this out than what I’ve got here.
So there’s also a lot more to do as far as simplifying these concepts and, more importantly, making them practical. I’m going to return to this subject at a later date but, for now, I hope there’s some food for thought here and maybe a couple of things you can apply in your own work.
Andrew Sheves Bio
Andrew Sheves is a risk, crisis, and security manager with over 25 years of experience managing risk in the commercial sector and in government. He has provided risk, security, and crisis management support worldwide to clients ranging from Fortune Five oil and gas firms, pharmaceutical majors and banks to NGOs, schools and high net worth individuals. This has allowed him to work at every stage of the risk management cycle from the field to the boardroom. During this time, Andrew has been involved in the response to a range of major incidents including offshore blowout, terrorism, civil unrest, pipeline spill, cyber attack, coup d’etat, and kidnapping.

Leave a Reply