
Down to the last week of preparation for the exam on March 2nd. Good luck to all those signed up for that exam date. Time to focus on preparing your notes, organizing your references and doing a final run through of practice exams. [Read more…]
Your Reliability Engineering Professional Development Site
Find all articles across all article series listed in reverse chronological order.
Down to the last week of preparation for the exam on March 2nd. Good luck to all those signed up for that exam date. Time to focus on preparing your notes, organizing your references and doing a final run through of practice exams. [Read more…]

There are rare situations when we would like to estimate the reliability at the lower confidence level after estimating the mean from a sample (often a test result). And, to make even more rare of a situation, we know the population standard deviation. [Read more…]
The operating characteristic curve is used to understand lot sampling plan. It graphically provides a relationship between the unknown lot’s defect rate (or total) and the probability of the specific sampling plan to accept the lot. Very good plans discriminate between good and bad lots. Poor plans may accept bad lots or reject good lots to easily. [Read more…]

A skill needed for the CRE exam is the ability to look up probabilities given a z-value using a standard normal table. It’s old school, I know, yet without software, you most likely will have to find a few values in this manner.
A z-value is the number of standard deviations from the mean at least that’s how I think of it. The area under the curve to the right or left of the z-value is then the probability of interest. Of course, I’m talking about the normal distribution probability density function or what we commonly all the ‘bell-shaped’ curve. [Read more…]

 Ideally, in every design of every component, the stress – strength relationship looks like this figure. The stress is well below the strength. [Read more…]
In the analysis of repairable equipment, one may need to make the assumption of constant failure rate. In my opinion, anytime one wants to make the assumption of constant failure rate, it should be validated. [Read more…]

An error that I see on occasion is the use of statistical confidence with a goal or target value. For example, we want 95% reliability at five years with 90% confidence. What does that mean? [Read more…]
I find the world of maintenance a very odd place to find MTBF. While it is possible, that a set of equipment or a machine may actually have a constant failure rate it is the exception rather than all that common. Assuming a constant failure rate doesn’t make it so. [Read more…]

Hypothesis testing permits us to compare two groups of items and determine if there is a significant difference or not. There are many types of hypothesis tests depending on the specific question, type of data, and what is or is not known when designing the test. [Read more…]

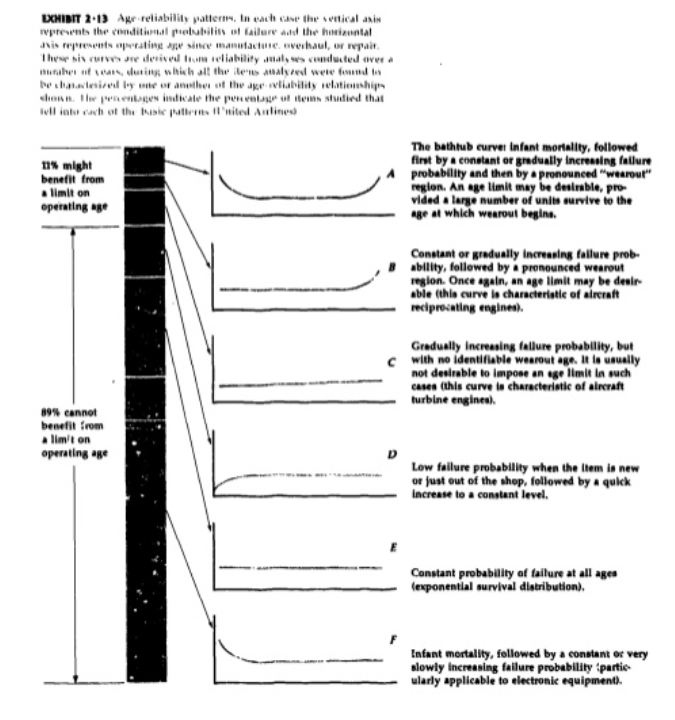
The document by Nowlan and Heap
Part of keeping equipment operational is affecting repairs appropriately. Sometimes it makes sense to replace an element of some equipment before it fails, i.e. automobile tires as the tread wears. Sometimes is doesn’t make sense to repair a functioning unit as the result would be a system that is less reliable then before. [Read more…]

As we continue to find and improve ways to master our environment, accomplish tasks, communicate, move, heal, etc. we continue to discover new materials, processes, and products. Emerging technologies often promise
They also may last longer.
As a minimum, they should last long as current solutions or longer or provide another compelling reason to use the new technology. [Read more…]
The WordPress.com stats helper monkeys prepared a 2012 annual report for this blog.

Here’s an excerpt:
600 people reached the top of Mt. Everest in 2012. This blog got about 11,000 views in 2012. If every person who reached the top of Mt. Everest viewed this blog, it would have taken 18 years to get that many views.
Once again those with a CRE are at or near the top of the salaries reported in this survey. See more at http://www.qualityprogress.com/salarysurvey

I never did like taking final exams in college as I viewed them as four hours I would rather spend doing something (anything) else. An exam is a check of what you know about a topic or subject. We prepared for those exams by reading, studying, practicing working problems (doing homework) and trying to understand the key concepts, trends, themes, etc. Some of my classmates thought it was about how much they could stuff into short term memory, others though sleep deprivation had something to do with preparing for an exam. [Read more…]
Just a couple of sample questions from deep in the body of knowledge this week.
Which of the following can be evaluated with dye penetrant methods? [Read more…]