
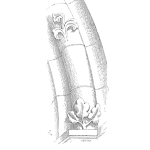
Can you identify and name this fracture pattern?
How can you tell it is that fracture pattern?
Where are the origin(s) of the failure on the fractured surface?
How can you tell where the origin(s) are?
Your Reliability Engineering Professional Development Site
Find all articles across all article series listed in reverse chronological order.
Can you identify and name this fracture pattern?
How can you tell it is that fracture pattern?
Where are the origin(s) of the failure on the fractured surface?
How can you tell where the origin(s) are?
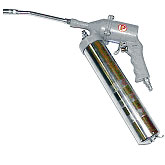 I can remember the first time I was told to grease a bearing. I ask the millwright “How do I know when there is enough grease?”. He responded, ” When you see it come out of the sides of the bearing”… How many of you had this same experience?
During this brief instruction, there was no mention of selecting the right grease, preventing contamination, etc. So, with this experience in mind, I wanted to provide what I believe are best practices when using a grease gun. Why do I think there needs to be a review of how to grease with a grease gun? I still see manual lubrication performed with no regard for best practices, and lubrication is still a major contributor to equipment failures.
[Read more…]

CMMS systems were developed and became available around 1965. Traditionally, CMMS software was reserved for big companies that needed to automate and organize large, complex maintenance operations. Only the largest manufacturing firms were able to use maintenance software back then, but things have changed dramatically since those days.

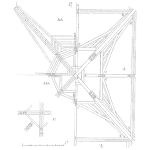
Fault tree analysis (FTA) is used to establish a potential chain or path of equipment failures using Boolean logic to generate a graphical relationship of events leading to part or system failure. It is a deductive approach that is useful for different systems or facilities at the product design or operational stages. FTA fosters reliability of systems by: [Read more…]

Have faith to seize on opportunities that come your way (but the risk is within us!)
Everyone has opportunities. But it is up to us to seize the opportunities that come our way!
There will be opportunities to build lives, to better ourselves, or to serve the community.
You can wait for something to break, then fix it, or you can be proactive and manage the failure before it causes you problems. Being proactive is all about managing failures and their consequences before they occur. The failure itself, in some cases, is unavoidable, but how you manage consequences is entirely within your control.
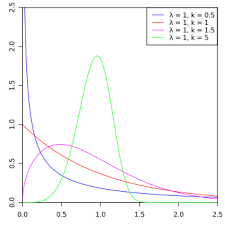
In the last article, we learned how to compute and graphically interpret both main effects and interaction effects. Eventually, the statistically significant effects will be used to develop a predictive model. But how do we determine which effects are statistically significant?
Conceptually, we first develop an “error” distribution that represents the distribution of Insignificant Effects. If we have an idea of what the Insignificant Effects look like, we can determine which of the effects we compute look significant by comparison. [Read more…]

Software tools are a cornerstone of modern Reliability Engineering, enabling reliability practitioners to perform their analysis without getting bogged down in the details of the underlying mathematical processes. There are many software tools available for reliability engineering, some of which are tailored to this application, while others are more general statistical tools which can be adapted to the needs of reliability engineers. One thing these tools have in common is their graphical user interface (GUI). The GUI requires only a basic level of knowledge to operate, but with a few clicks of the correct buttons, the desired task can be achieved with relatively little mental effort. It is the user friendly GUI that draws reliability engineers to select such applications as their tools of choice for performing reliability engineering analyses.

RCA Self-Assessment Tool. (linked version no longer available) The purpose of this tool is to allow individuals or groups to anonymously self-assess their current RCA system. How they wish to use the results is completely up to them!
All results are private and not retained anywhere. Therefore, if you wanted to keep your results, you would have to print them out and scan them back into your work station (or your past results are gone).
 Almost all maintenance, reliability or asset management professionals have heard of reliability engineering. But what is reliability engineering? A quick google search will return the following definition “Reliability Engineering is engineering that emphasizes dependability in the lifecycle management of a product. Dependability, or reliability, describes the ability of a system or component to function under stated conditions for a specified period of time.”
[Read more…]

Computerized data gathering and information management systems are indispensable tools for business. Just remember the last power failure you experienced and you’ll understand. Technology continues to develop and become more complex. The array of available business applications is astounding and more are added daily.

Often, the end of the risk assessment feels like the end of the process and things start to ease off. Unfortunately, this is when the real work begins because, now that you have identified and prioritized your risks, you need to do something about them.
There are several options when it comes to dealing with a risk but it’s risk treatments I want to focus on here. These often go askew when mitigation measures aren’t designed carefully. This wastes resources and the risks aren’t reduced.

When analyzing a continuous variable or type of measurement using statistics, an analyst often assumes data is normally distributed. But, how can this normal assumption be verified? While there are numerical normality tests, an alternate approach is to use graphical methods. The old adage, “A picture is worth a thousand words”. This captures the idea that the human mind is good at discerning patterns.

Statistical Process Control (SPC) charts allow timely detection of assignable causes of process changes (e.g. shifts, trends, variation) so that root causes may be determined and corrective actions taken before product performance is adversely impacted. Proper use of SPC identifies and eliminates “special cause” sources of variation. To achieve desired process capability, sources of “common cause” variation may need to be identified as well, using tools such as Design of Experiments to develop process understanding and predictive models that explain the source of the unwanted variability. [Read more…]
Your engineering team tells you the new deep-water product is ready for field trials because it has passed an API validation test in the lab. But as the OEM engineering manager overseeing product development, how do you know that passing just the validation test is sufficient? [Read more…]