Accendo Reliability

Your Reliability Engineering Professional Development Site

  • Home
  • About
    • Contributors
    • About Us
    • Colophon
    • Survey
  • Reliability.fm
  • Articles
    • CRE Preparation Notes
    • NoMTBF
    • on Leadership & Career
      • Advanced Engineering Culture
      • ASQR&R
      • Engineering Leadership
      • Managing in the 2000s
      • Product Development and Process Improvement
    • on Maintenance Reliability
      • Aasan Asset Management
      • AI & Predictive Maintenance
      • Asset Management in the Mining Industry
      • CMMS and Maintenance Management
      • CMMS and Reliability
      • Conscious Asset
      • EAM & CMMS
      • Everyday RCM
      • History of Maintenance Management
      • Life Cycle Asset Management
      • Maintenance and Reliability
      • Maintenance Management
      • Plant Maintenance
      • Process Plant Reliability Engineering
      • RCM Blitz®
      • ReliabilityXperience
      • Rob’s Reliability Project
      • The Intelligent Transformer Blog
      • The People Side of Maintenance
      • The Reliability Mindset
    • on Product Reliability
      • Accelerated Reliability
      • Achieving the Benefits of Reliability
      • Apex Ridge
      • Field Reliability Data Analysis
      • Metals Engineering and Product Reliability
      • Musings on Reliability and Maintenance Topics
      • Product Validation
      • Reliability by Design
      • Reliability Competence
      • Reliability Engineering Insights
      • Reliability in Emerging Technology
      • Reliability Knowledge
    • on Risk & Safety
      • CERM® Risk Insights
      • Equipment Risk and Reliability in Downhole Applications
      • Operational Risk Process Safety
    • on Systems Thinking
      • Communicating with FINESSE
      • The RCA
    • on Tools & Techniques
      • Big Data & Analytics
      • Experimental Design for NPD
      • Innovative Thinking in Reliability and Durability
      • Inside and Beyond HALT
      • Inside FMEA
      • Institute of Quality & Reliability
      • Integral Concepts
      • Learning from Failures
      • Progress in Field Reliability?
      • R for Engineering
      • Reliability Engineering Using Python
      • Reliability Reflections
      • Statistical Methods for Failure-Time Data
      • Testing 1 2 3
      • The Manufacturing Academy
  • eBooks
  • Resources
    • Accendo Authors
    • FMEA Resources
    • Glossary
    • Feed Forward Publications
    • Openings
    • Books
    • Webinar Sources
    • Podcasts
  • Courses
    • Your Courses
    • Live Courses
      • Introduction to Reliability Engineering & Accelerated Testings Course Landing Page
      • Advanced Accelerated Testing Course Landing Page
    • Integral Concepts Courses
      • Reliability Analysis Methods Course Landing Page
      • Applied Reliability Analysis Course Landing Page
      • Statistics, Hypothesis Testing, & Regression Modeling Course Landing Page
      • Measurement System Assessment Course Landing Page
      • SPC & Process Capability Course Landing Page
      • Design of Experiments Course Landing Page
    • The Manufacturing Academy Courses
      • An Introduction to Reliability Engineering
      • Reliability Engineering Statistics
      • An Introduction to Quality Engineering
      • Quality Engineering Statistics
      • FMEA in Practice
      • Process Capability Analysis course
      • Root Cause Analysis and the 8D Corrective Action Process course
      • Return on Investment online course
    • Industrial Metallurgist Courses
    • FMEA courses Powered by The Luminous Group
    • Foundations of RCM online course
    • Reliability Engineering for Heavy Industry
    • How to be an Online Student
    • Quondam Courses
  • Calendar
    • Call for Papers Listing
    • Upcoming Webinars
    • Webinar Calendar
  • Login
    • Member Home
  • Barringer Process Reliability Introduction Course Landing Page
  • Upcoming Live Events
You are here: Home / Archives for Articles / on Tools & Techniques / Big Data & Analytics

Big Data & Analytics

by Dennis Craggs 2 Comments

AEC Q100 Test Sample Sizes

AEC Q100 Test Sample Sizes

Introduction

Automotive Electronic parts are qualified before usage in serial production. When product quality and reliability are poor, then assembly problems, high warranty costs, poor service, and recalls occur. The OEM’s and suppliers followed different qualification plans.  Ford, GM, and Chrysler and large parts suppliers started the Automotive Electronics Council (AEC) in the 1990’s, with the mission of defining a suite of common qualification tests. 

The first qualification standard was Q100, which defined stress tests for electronic components containing integrated circuits. These components are in every electronic control module, some sensors, entertainment systems, safety systems, and, in the future, autonomous driving systems. 

[Read more…]

Filed Under: Articles, Big Data & Analytics, on Tools & Techniques

by Dennis Craggs Leave a Comment

Lognormal Probability Plots

Lognormal Probability Plots

Introduction

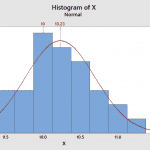
In general, a statistical analysis of univariate data starts with a histogram. If the histogram doesn’t show a bell shape, the data probably does not follow a normal distribution. If the logarithm of the data plots as a normal histogram, then the data is lognormally distributed. Any statistical projections and parameter estimates are based on the normal distribution of the log of the data.  This article focuses on the lognormal distribution and the lognormal probability plot.

[Read more…]

Filed Under: Articles, Big Data & Analytics, on Tools & Techniques Tagged With: Lognormal Distribution

by Dennis Craggs Leave a Comment

Introduction to Normal Probability Plots

Introduction to Normal Probability Plots

Introduction

When analyzing a continuous variable or type of measurement using statistics, an analyst often assumes data is normally distributed. But, how can this normal assumption be verified? While there are numerical normality tests, an alternate approach is to use graphical methods. The old adage, “A picture is worth a thousand words”. This captures the idea that the human mind is good at discerning patterns.

[Read more…]

Filed Under: Articles, Big Data & Analytics, on Tools & Techniques

by Dennis Craggs Leave a Comment

MSA 5 – Gage Stability

Introduction

The gage measurements are expected to be stable, meaning the gage should provide consistent readings. Some random variation due to random error is expected. However, gage measurements change with time or because the gage is damaged. The gage stability can be checked by measuring a known reference.

In this article, it is shown how to use control charts to assess gage stability.

[Read more…]

Filed Under: Articles, Big Data & Analytics, on Tools & Techniques

by Dennis Craggs 7 Comments

MSA 4 – Gage Linearity

MSA 4 – Gage Linearity

Introduction

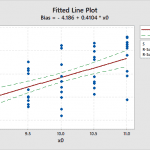
The prior article, MSA 3: Gage Bias, focused on defining and calculating a point estimate of gage bias. A method was presented to determine if the bias was statistically significant. If significant, the bias would be applied to the data as a correction factor.

This article discusses gage bias linearity over a measurement range.

[Read more…]

Filed Under: Articles, Big Data & Analytics, on Tools & Techniques Tagged With: Measurement System Analysis (MSA)

by Dennis Craggs Leave a Comment

MSA 3 – Gage Bias

MSA 3 – Gage Bias

Introduction

In my prior article, Measurement Systems, the total variation in the measurement data was partitioned into part variation (PV), assessor variation (AV), and equipment variation (EV). GR&R is the square root of the sum of the squares of AV and EV. If the ratio of GRR/TV is less than 10%, then the measurement system variation was acceptable.

In addition to variation, data bias needs to be considered. This bias is created by systematic measurement errors.
[Read more…]

Filed Under: Articles, Big Data & Analytics, on Tools & Techniques

by Dennis Craggs Leave a Comment

MSA 2 – Gage Variation

MSA 2 – Gage Variation

Most of us rely on accurate measurements. If these measurements are unreliable, then our decisions could be based on false information. How can we have confidence in our measurements?

The purpose of a measurement system analysis is to determine if a gauge is fit for use. This means that we can rely upon the measurements to give us a true indication of the parameter being measured. Our decisions will not be affected by erroneous data. So how can we know the quality of our measurements?
[Read more…]

Filed Under: Articles, Big Data & Analytics, on Tools & Techniques Tagged With: Measurement System Analysis (MSA)

by Dennis Craggs 2 Comments

100% Inspection

100% Inspection

Introduction

When it is necessary to check 100% of parts for one or more characteristic?

There are  situations where 100% of manufactured parts are checked. These include visual inspection, measurements of a part characteristic, and a reaction to low process capability. These may be accomplished manually or an automated process.
[Read more…]

Filed Under: Articles, Big Data & Analytics, on Tools & Techniques

by Dennis Craggs 3 Comments

When should SPC be used?

When should SPC be used?

Introduction

Many companies use SPC to control their manufacturing and assembly processes. Other companies use 100% inspection and some companies do nothing. How can one choose between these three alternatives?

To make a rational choice, some questions need to be answered.

  • What are the costs of internal and external failure on similar product?
  • Is the product design and/or process flow new, modified or carryover?
  • Are critical characteristics for the part and process known?
  • Are the process capabilities known?

[Read more…]

Filed Under: Articles, Big Data & Analytics, on Tools & Techniques Tagged With: Process capability, Statistical Process Control (SPC)

by Dennis Craggs 3 Comments

SPC Average and Range Charts

SPC Average and Range Charts

Introduction

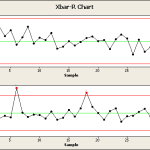
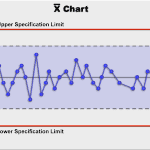
In my prior article, the assumptions behind SPC were discussed in detail except for the analysis. There are two types data that may be analyzed, Counts and Measurement variables. This article focuses on normally distributed measurement variables, and the construction and usage of $-\bar{X}-$ and R charts.
[Read more…]

Filed Under: Articles, Big Data & Analytics, on Tools & Techniques Tagged With: Statistical Process Control (SPC)

by Dennis Craggs Leave a Comment

SPC Assumptions

SPC Assumptions

Introduction

Statistical Process Controls (SPC) is a suite of methods that can be employed to control a manufacturing or assembly process. It has a wide range of potential applications ranging from consumer products to defense. It can be employed at the lowest element of component manufacturing or an assembly operation.

This article discusses the assumptions necessary to understand SPC.

Fundamental Assumptions

  • The process is stable and in control.
  • The data are independent of each other.
  • The data of each subgroup are identically distributed.
  • Real valued data are approximately normally distributed and counting data may be approximated by the normal distribution.
  • A measurement can occur in only one subgroup, i.e., sampling without replacement.

[Read more…]

Filed Under: Articles, Big Data & Analytics, on Tools & Techniques

by Dennis Craggs Leave a Comment

Common and Special Causes of Variation

Common and Special Causes of Variation

Introduction

Quality Costs for manufacturing or services can be categorized as prevention and appraisal costs, and internal and external failure costs. Control occur in prevention and appraisal activities, both of which rely on data. However, when data is collected, it shows variation. One must understand variation to know how to react.

Dr. Deming indicated that 94% of variation is from common causes and about 6% is from special causes. So what are the common and special causes of variation?
[Read more…]

Filed Under: Articles, Big Data & Analytics, on Tools & Techniques

by Dennis Craggs Leave a Comment

Quality Costs

Quality Costs

Introduction

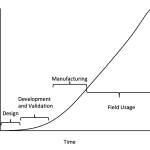
Businesses, to be competitive, need to control all costs. Product or service failure can result in large uncontrolled costs. As product development proceeds, the cost of failures increases. The concept is shown in figure 1.

Figure 1

[Read more…]

Filed Under: Articles, Big Data & Analytics, on Tools & Techniques Tagged With: Product development

by Dennis Craggs Leave a Comment

Telematics Data – State Analysis

Telematics Data – State Analysis

Introduction

A state variable is a parameter that is categorized into a countable number of defined states. Examples would include transmission gear states, PRNDL positions, ignition switch states, and others. Sometimes continuous variable, like pedal positions, may be binned into discrete states to be displayed as a histogram.  State  change timing is unpredictable since vehicle operation is highly variable. A way to deal with this data is Markov Analysis.

[Read more…]

Filed Under: Articles, Big Data & Analytics, on Tools & Techniques

by Dennis Craggs 2 Comments

Accelerated Tests

Accelerated Tests

Introduction

Reliability and durability are essential in today’s competitive market place. However, component reliability verification tests and system durability tests take a long time, cycles, or miles to complete. This puts these tests in direct conflict with program timing, product development budgets, and limited testing resources. To minimize this conflict, it is essential to accelerate these tests.

[Read more…]

Filed Under: Articles, Big Data & Analytics, on Tools & Techniques

  • 1
  • 2
  • 3
  • Next Page »
Big Data & Analytics series Article by Dennis Craggs

Join Accendo

Receive information and updates about articles and many other resources offered by Accendo Reliability by becoming a member.

It’s free and only takes a minute.

Join Today

Recent Articles

  • Gremlins today
  • The Power of Vision in Leadership and Organizational Success
  • 3 Types of MTBF Stories
  • ALT: An in Depth Description
  • Project Email Economics

© 2025 FMS Reliability · Privacy Policy · Terms of Service · Cookies Policy