
Optimum replacement time – Theory
The optimal asset replacement time calculation has one goal, and that is to calculate the lifetime of when assets should be operational as to have the lowest possible operating cost over its lifetime.
This means balancing two opposing forces, namely the increasing operational cost and unreliability of the asset as it ages, with the decreasing effective cost of ownership.
Somewhere along this journey, there will be a minimum total cost, which is the time to effectively replace the asset with a new one.
Read more: Calculating when to Economically replace Assets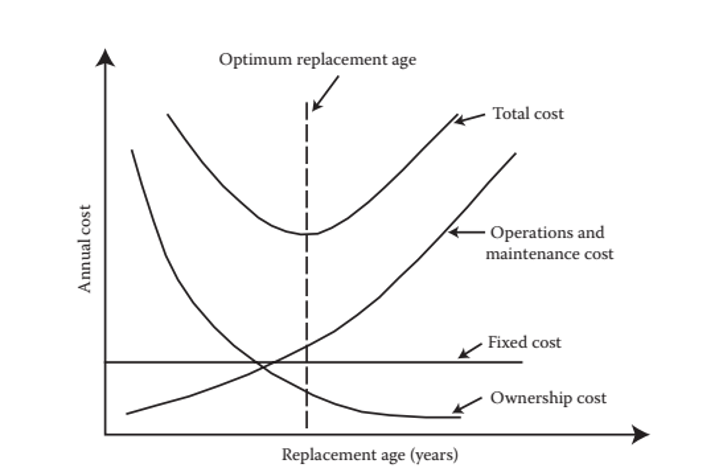
For large capital assets such as mining haul trucks and excavators, the cost difference between this optimal replacement interval and pushing this out by a few years can cost a company millions, and as a consultant in this space, its surprising to see these calculations being poorly done or non-existent. Therefore, this quick article will explain the theory behind the calculation, and why you should start doing these as a Reliability Engineer to get the maximum value out of your assets.
Cost of Ownership
The cost of ownership is one of the main curves in the optimal replacement chart, and it basically translates to how much it costs to own the asset in terms of purchase price and re-sale value.
There is a bit of a caveat engineers fall into often. The ownership cost is a normalized number (per year OR per hour). That’s why it ends up as a declining curve in the chart.
We know that the longer I own and asset, the less its resale value is. Think of this like cars, bikes etc. Sometimes this decline in resale value is accelerated in the early years, and minimises in the later years.
Let’s do an example quickly.


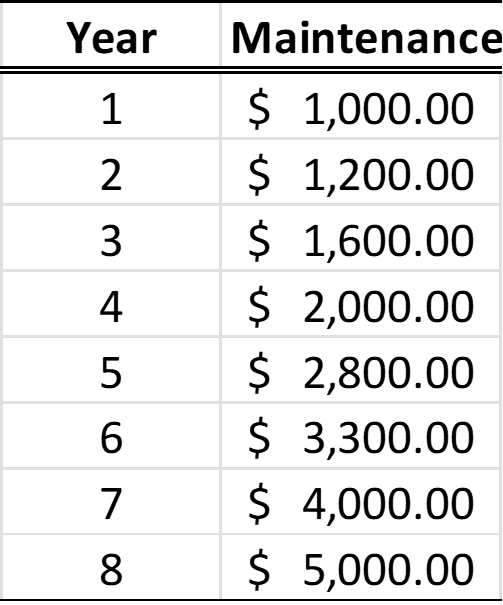
The table above shows the ownership cost over 5 years of an arbitrary asset.
See how this increases with time? (But decreases in the chart?), because the value in the chart is normalised by the operating time.
You must think of it is this way…
Every year my asset depreciates, I lose value, and the asset costs me more. (I would only take a 6K loss if I sold it in year 1 vs a 19K loss if sold in year 5). But in year 5 when my ownership cost is 19K, I’ve used it for more years than if I sold it in year 1. My per annum cost is thus different.
Operation and Maintenance Costs
Operation and Maintenance costs tend to increase as the asset increases in age.
Fixed costs don’t have an effect on the economic useful life, because they uniformly increase the value of ownership and Operations + Maintenance costs. This shifts the total cost higher, but doesn’t shift the curve minima.
For most industrial assets (most, not all) the operations cost is relatively fixed.
Take for example a mining Haul Truck…
The operational costs are mainly Diesel, lubricants, tyres and the wages of the operators. Yes, one could make the argument that as the engine and air filter age, the fuel efficiency decreases (which is true), but this cost increase is small in the big scheme of things.
Maintenance costs however, definitely increase over time, as expensive items (Engine, chassis, drives) require more in-depth maintenance to ensure structural integrity, safety and performance. This is usually evident in the OEM’s prescribed maintenance manual. These are also long-life items, that won’t need replacement until later (But are of high cost). Reliability of these types of equipment also decrease with age.
The chart below shows how the true costing of maintenance is quantified in practice.

Maintenance costs can be split between planned and unplanned maintenance costs. (See diagram below)

If your organization uses SAP as the CMMS, then unplanned maintenance events and costs will be captured in PM03 work orders and planned maintenance in PM01 and PM02 work orders. The work order should capture both labour and part costs.
This is important to separate, as you will see that as the asset ages every year, the PM03 work orders increase in frequency and cost. PM03 work orders capture specific small failure that aren’t captured in the Assets Functional location in detail.
You will need to understand the percentage cost of Unplanned and Planned to aid in the financial projections of your model.
Discount Rate
So how do you get the Discount rate?
- The discount rate is generally the Weighted Average Cost of Capital (WACC), which can be derived from the company’s Balance Sheet. (Some companies add a risk factor for projects that are risky, but for lifecycle costing this isn’t needed)
- The weighted average cost of capital is the weighted ratio of company capital that is Equity (Shares issued) and debt (bank loans, corporate bonds etc)
- Cost of debt is easy to calculate- its just the weighted average of the interest rate on a company’s loans (This is the return the banks or bondholders have set in their agreements)
- Cost of equity is the return expected by shareholders, and in public companies is specific to market return for similar sized companies in the same industry. (This is calculated by the Capital Asset Pricing Model CAPM for publicly traded companies). OR simply use the general market return in your Region for private companies.
- For lifecycle models, it is important to also consider the cost of components (and possibly labor) increasing over time. Normally one would use the Consumer Price Index (CPI)/ Industry materials index to model in inflation, however industrial part prices tend to increase at a higher percentage than CPI.
Model Framework

Model Pitfalls:
An important concept check and remember…
The Equalized Maintenance cost is calculated slightly different than the equalized Ownership cost.
Remember, you have to think of costs in the model this way:
If the asset cost me $xx up till this date, how much was that effectively per year/hour?
So the maintenance cost is the cumulative cost up until the year you are considering, divided by that year. As you’ve incurred the maintenance costs from the previous years in owning the asset.
This is different to ownership cost, where the cost in any single year is the difference between Purchase Price and Resale value. This value is discrete, and not dependent on any previous year’s value (That’s why we simply divide the ownership cost by the year we are considering).
A Short Example:
Below you’ll see some information on the maintenance costs, Purchase Price and Resale value of an arbitrary asset. Assume the Discount rate is 5%. What is the optimal replacement year?
Operations costs are not required.

Applying the calculations from the flow chart, we produce the following data and chart:


We can see that the minimum Total Equalized costs occurs in year 7, therefore we should replace the asset at the end of that year to optimally benefit from the lowest cost of ownership.

Leave a Reply